The S&P 500 has gotten absolutely hammered during the trading session on Thursday, and worse yet even close that the very lows.
Technical Analysis
The following are the most recent pieces of Forex technical analysis from around the world. The Forex technical analysis below covers the various currencies on the market and the most recent trends, technical indicators, as well as resistance and support levels.


The S&P 500 has gotten absolutely hammered during the trading session on Thursday, and worse yet even close that the very lows.
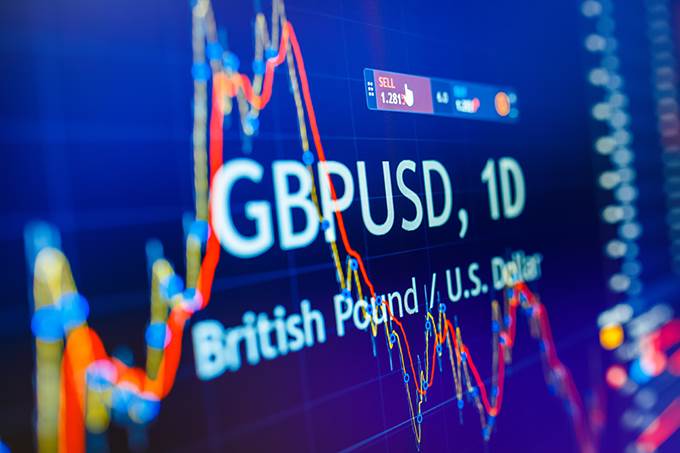
The British pound has gone back and forth during the trading session on Thursday, as we continue to see a lot of confusion when it comes to the global markets.
The NASDAQ 100 E-mini contract has broken down extraordinarily low during the trading session on Thursday, as we see a lot of massive negativity.
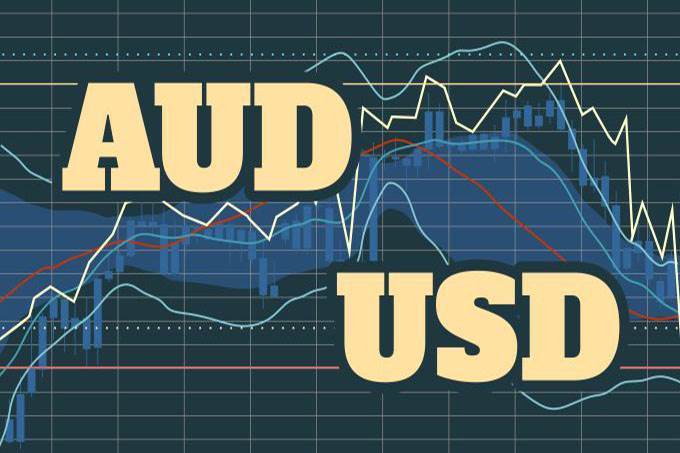
The Australian dollar has rallied significantly during the trading session on Thursday, but as you can see the rest of the world fell apart.
The natural gas markets have broken down significantly during the trading session on Thursday, slicing through the $1.80 level.
Bitcoin markets initially fell again on Thursday but found enough support just above the 200 day EMA to show signs of life again.
The West Texas Intermediate Crude Oil market has broken down significantly during the trading session on Thursday but has bounced from the extreme lows.
The gold markets rallied a bit during the trading session on Thursday, breaking above the $1650 level.
Trade negotiations between the EU and the UK are under new time pressure after the UK government announced that if no progress has been made
As Covid-19 continues to spread globally, panic selling has impacted commodity currencies like the New Zealand Dollar.
The Euro has been all over the place during the Wednesday session, piercing the 1.09 level one point but then pulling back to form a somewhat neutral candle.
The Australian dollar is likely to continue breaking down, as we have sliced through the recent support level.
The S&P 500 has been all over the place during a very volatile session on Wednesday, initially tried to rally but given back those gains as computers traded the word “pandemic”
The US dollar bounced a bit during the trading session on Wednesday, as the ¥110 level continues offer a bit of support.
The NASDAQ 100 has been all over the place during a very volatile session on Wednesday, as the markets don’t really know what to do.