Bitcoin markets continue to show signs of support underneath, although the Friday session was relatively quiet.
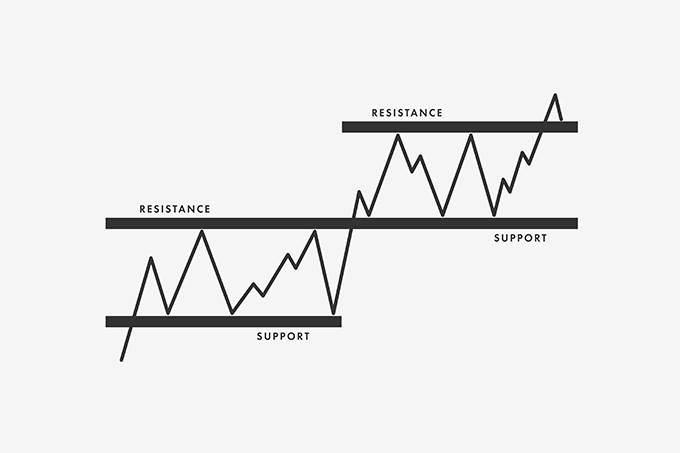
Technical Analysis
The following are the most recent pieces of Forex technical analysis from around the world. The Forex technical analysis below covers the various currencies on the market and the most recent trends, technical indicators, as well as resistance and support levels.


Bitcoin markets continue to show signs of support underneath, although the Friday session was relatively quiet.
Silver markets have pulled back slightly during the trading session on Friday, reaching down towards the $17.50 level, an area that begins a supportive level down to the $17.25 level, possibly even as low as $17.00 underneath.
The West Texas Intermediate Crude Oil market has broken down a bit during the trading session on Friday, reaching down towards the $35 level.
The Indonesian Rupiah has accomplished a valid strong trend and seen the USD/IDR be sold consistently since the height of the IDR’s weakness in early April.
The gold market initially tried to rally during the trading session on Friday but found the $1750 level to be resistant, which I think extends all the way to the $1775 level.
Get our trading strategies with our monthly & weekly forecasts of currency pairs worth watching using support & resistance for the week of June 14, 2020.
Get the Forex Forecast using fundamentals, sentiment, and technical positions analyses for major pairs for the week of June 14, 2020 here.
Start the week of June 14, 2020 with our Forex forecast focusing on major currency pairs here.
US Federal Reserve Chairman Powell delivered a pessimistic outlook on the economic recovery potential.
Global equity markets rallied over the past two months, driven by misplaced economic optimism of retail traders.
According to the Global Economic Prospects report for June 2020, distributed by the World Bank, the economy will face a 5.2% GDP contraction.
The Euro initially tried to rally on Thursday but continues to see a lot of resistance at the 1.14 handle.
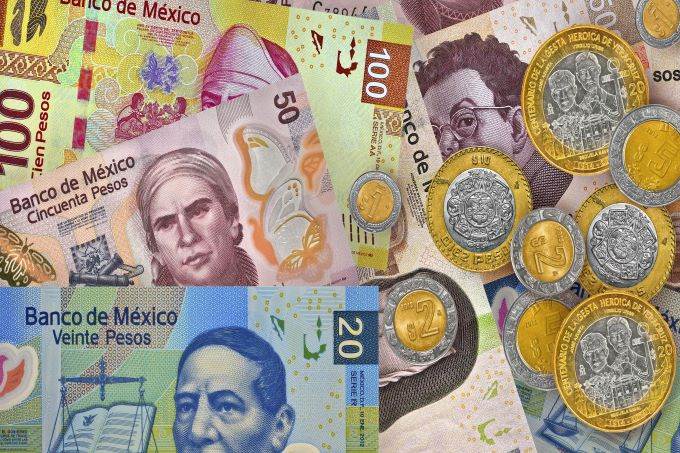
The Mexican peso got absolutely crushed during trading on Thursday, as there was a major “risk off” move around the world.
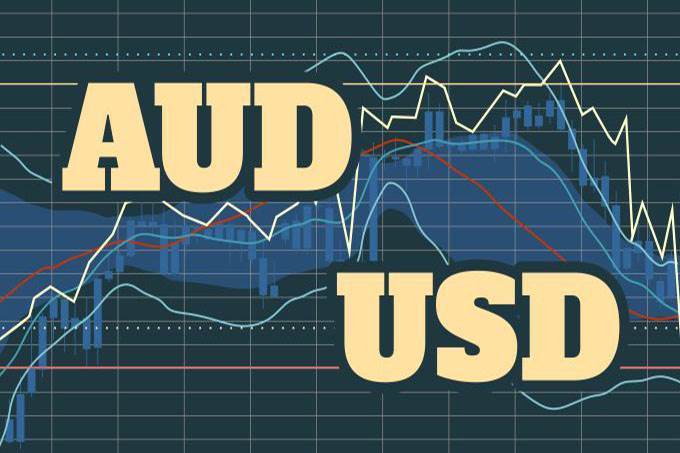
The Australian dollar has broken down significantly during the trading session on Thursday, ripping through the bottom of several candlesticks that had led the market up to this area.
The US dollar has fallen a bit during the trading session on Thursday, breaking below the ¥107 level.