The Euro initially fell during the trading session on Friday, reaching down below the 1.18 level initially, but then turned around to rally towards the 1.1850 level.
Technical Analysis
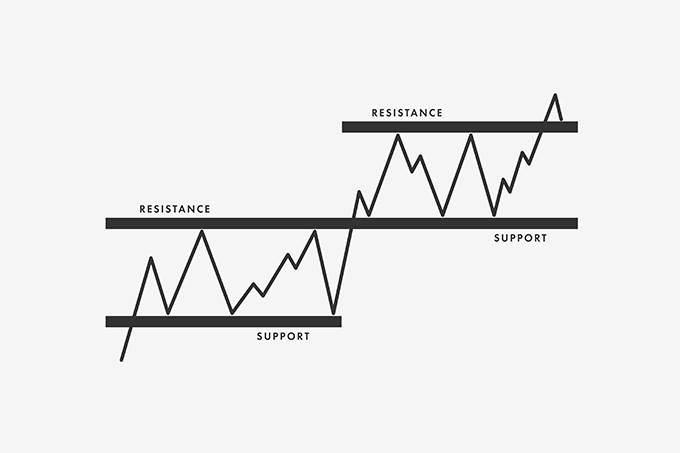
The following are the most recent pieces of Forex technical analysis from around the world. The Forex technical analysis below covers the various currencies on the market and the most recent trends, technical indicators, as well as resistance and support levels.


The Euro initially fell during the trading session on Friday, reaching down below the 1.18 level initially, but then turned around to rally towards the 1.1850 level.
The British pound initially tried to rally during the trading session on Friday but gave back the gains above the 1.31 handle.
Silver markets have gone back and forth during the trading session on Friday, as we initially tried to rally but gave back the gains early.
The Bitcoin markets initially rallied during the trading session on Friday but found the going a bit tough during the trading session as we had been overbought for some time.
Gold markets have gone back and forth during the trading session on Friday as we are looking for some type of direction
The Euro has been very noisy over the last 30 days, settling on a more bullish attitude than anything else.
The NASDAQ 100 continues to be very noisy, but at the end of the day it is an index that should never be shorted.
The S&P 500 has been bullish during the month of October, as we head towards the overall election’s nonsense and of course potential stimulus.
WTI Crude Oil has found a rather comfortable value range the past month.
Gold markets have gone back and forth during the course of the month of October, and at this point it seems like the $1900 level should continue to be a bit of a magnet for price.
Silver: Accumulation and Consolidation and Opportunity
The DAX has gone back and forth during the course of October, as we are still trying to figure out what to do next.
USD/INR: Indian Rupee Trends Offer Potential Tradable Range
USD/ZAR: Key Support Should Keep Rand Speculators Alert
Get our trading strategies with our monthly & weekly forecasts of currency pairs worth watching using support & resistance for the week of October 25, 2020.