The FTSE 100 initially fell during the trading session on Wednesday to reach down towards the 6800 level.
Technical Analysis
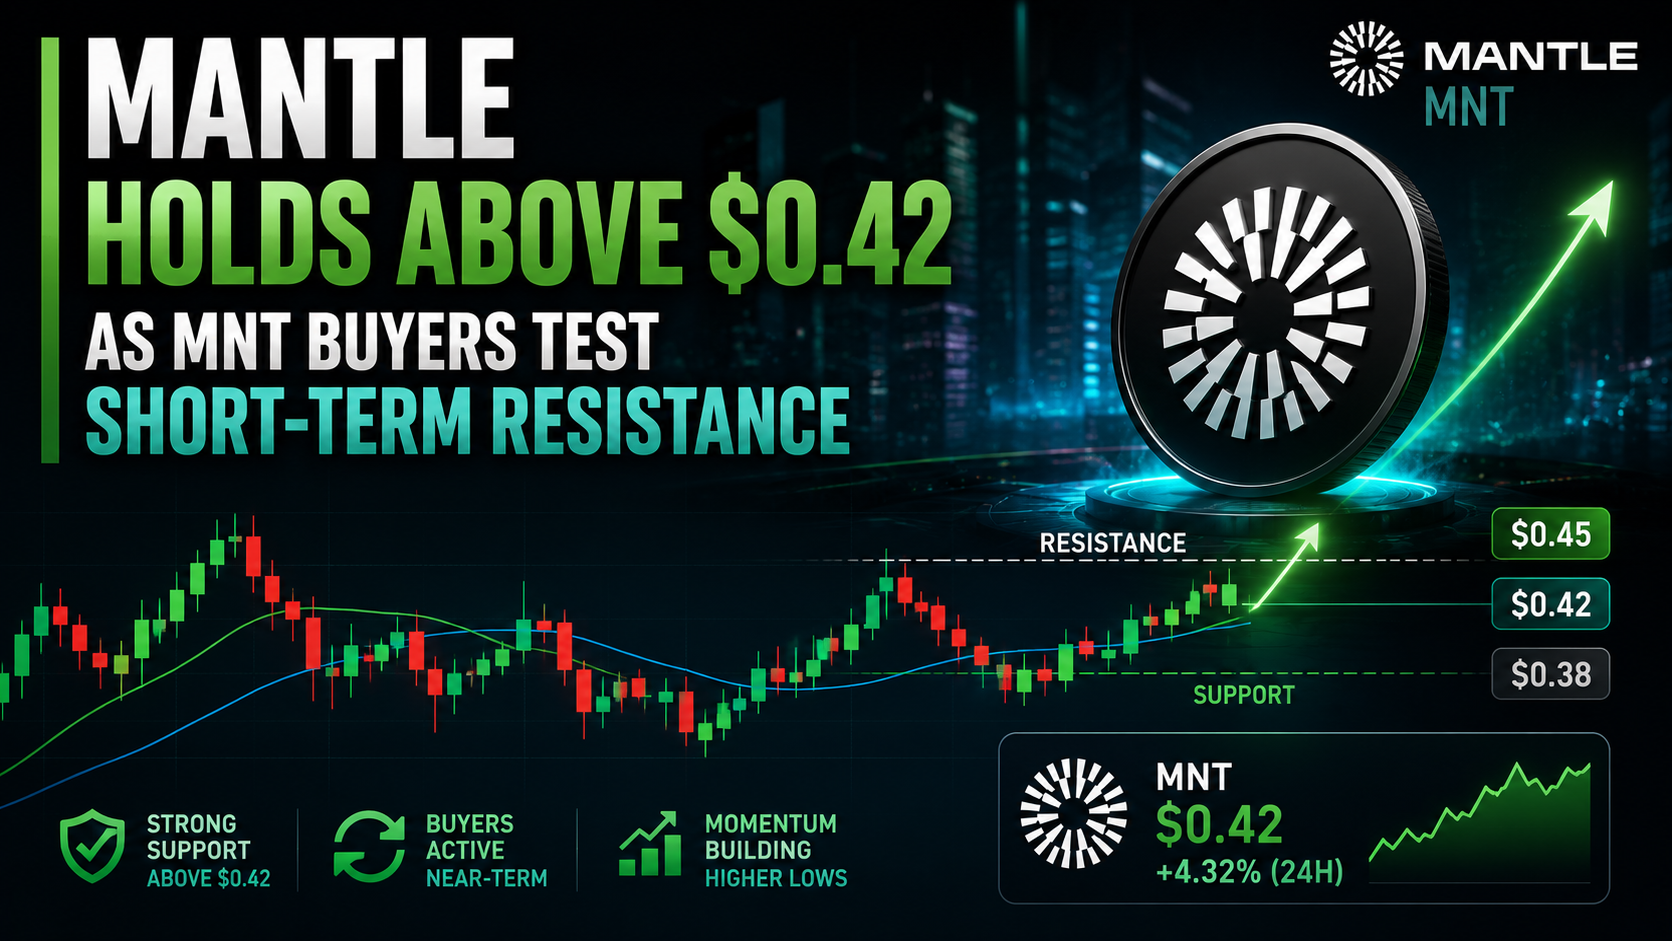
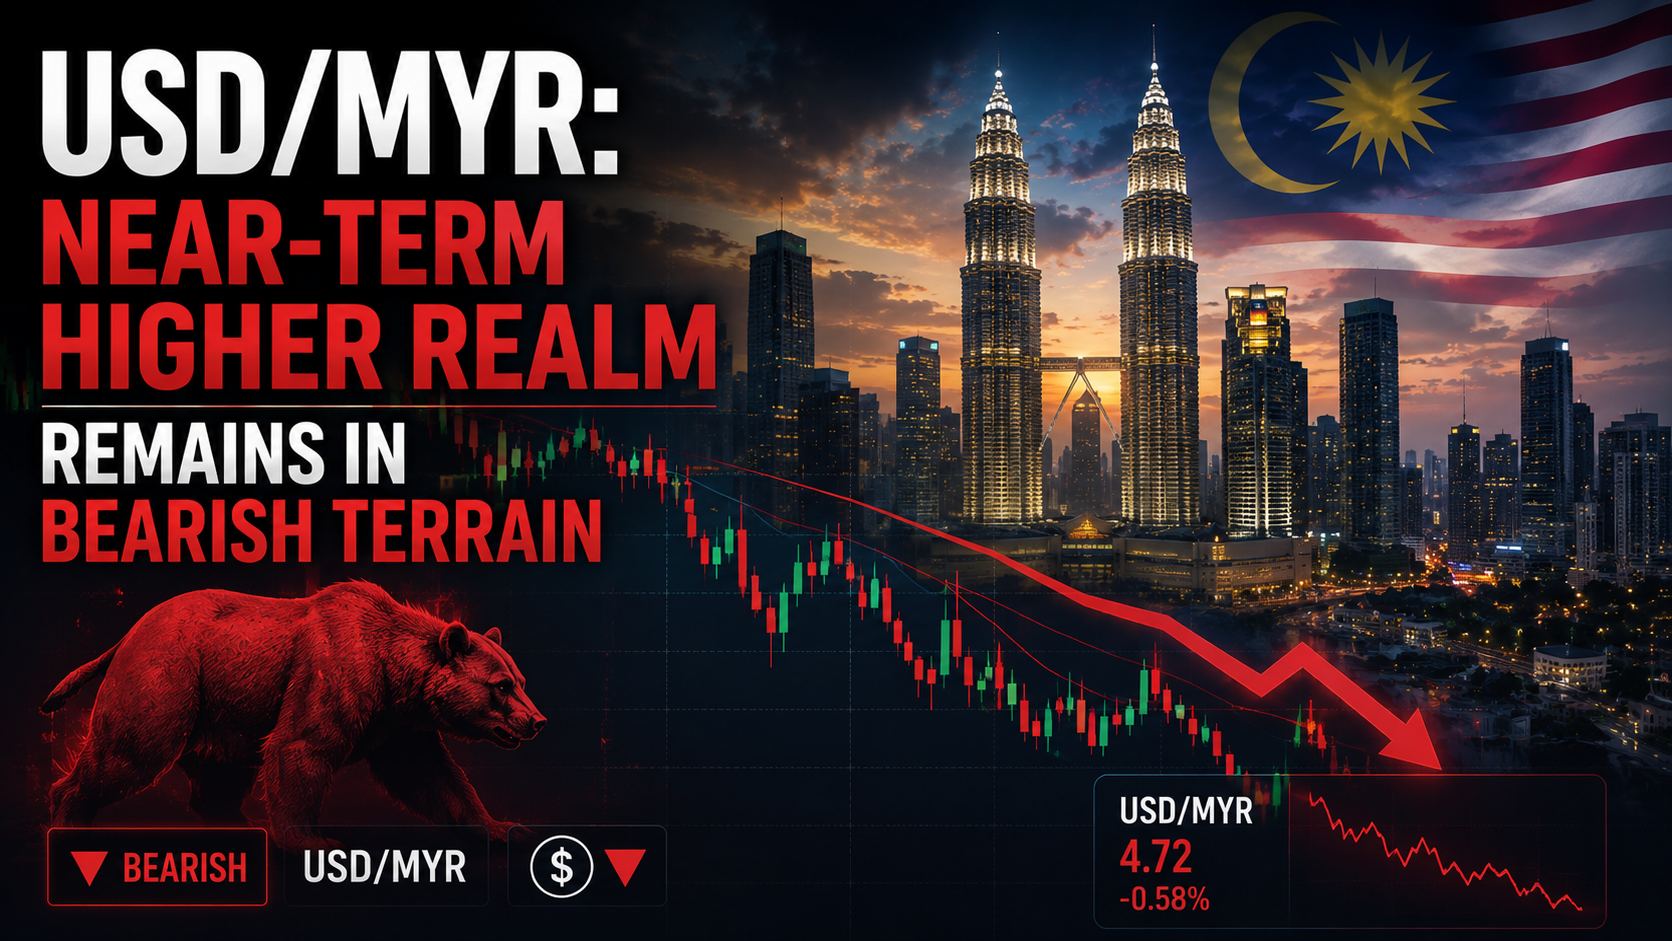
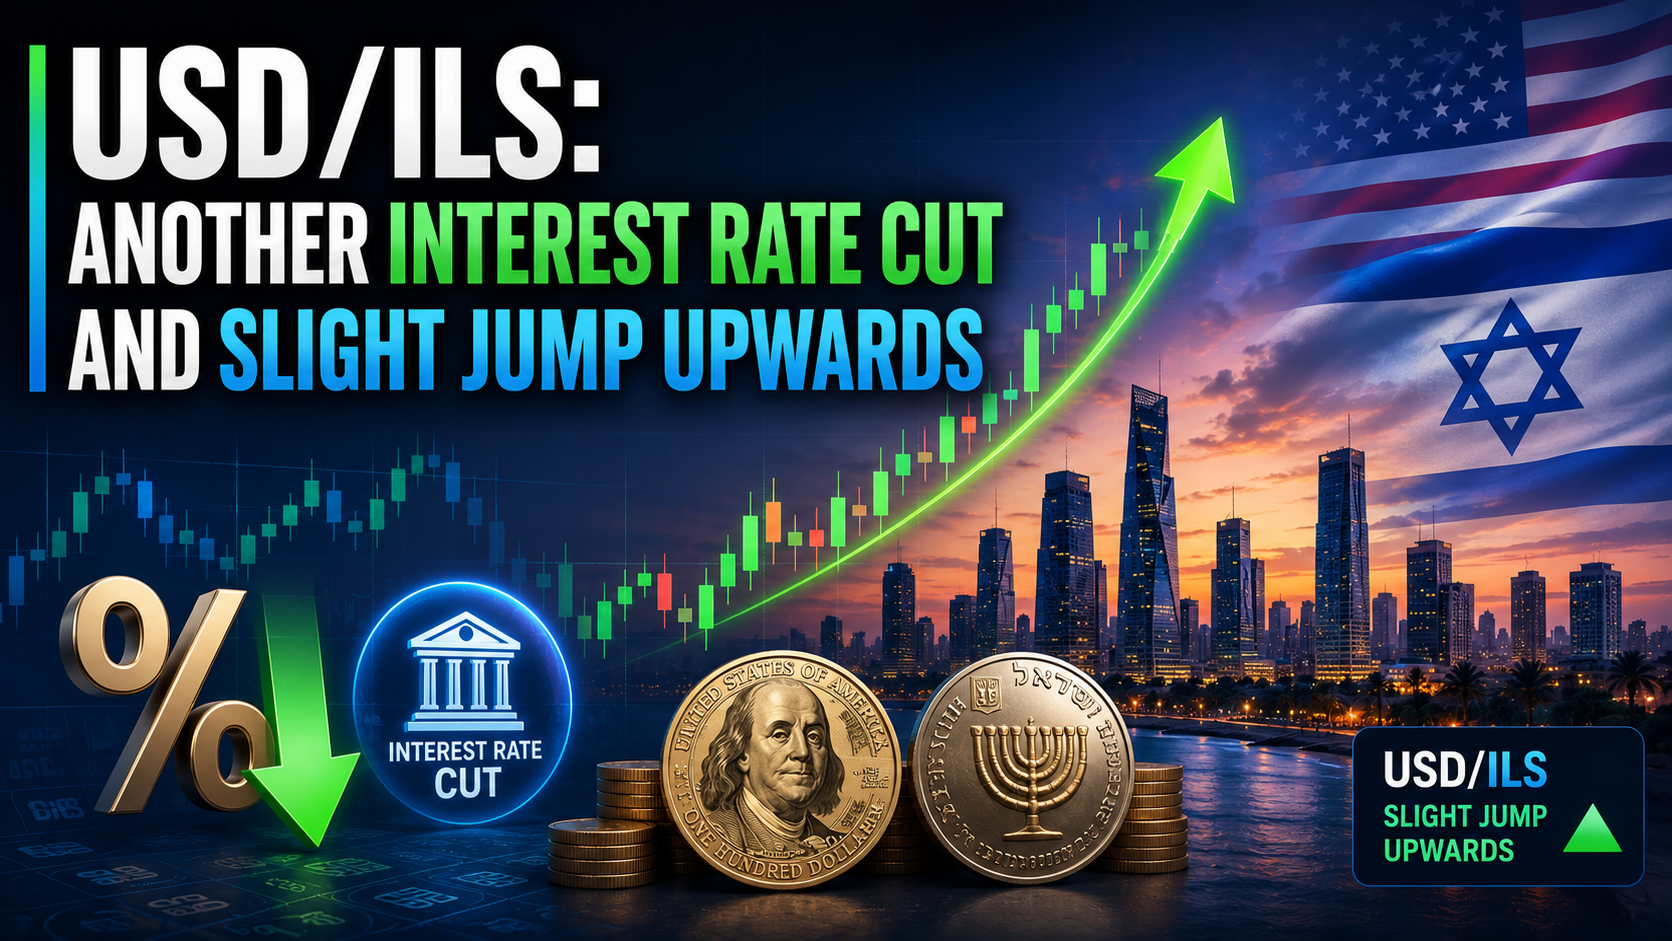
The following are the most recent pieces of Forex technical analysis from around the world. The Forex technical analysis below covers the various currencies on the market and the most recent trends, technical indicators, as well as resistance and support levels.
The FTSE 100 initially fell during the trading session on Wednesday to reach down towards the 6800 level.
The gold market rallied a bit during the trading session on Wednesday to pierce the 200-day EMA, but did pull back just a bit towards the end of the session.
The Australian dollar initially dipped during the trading session on Wednesday but then turned around to show signs of strength again.
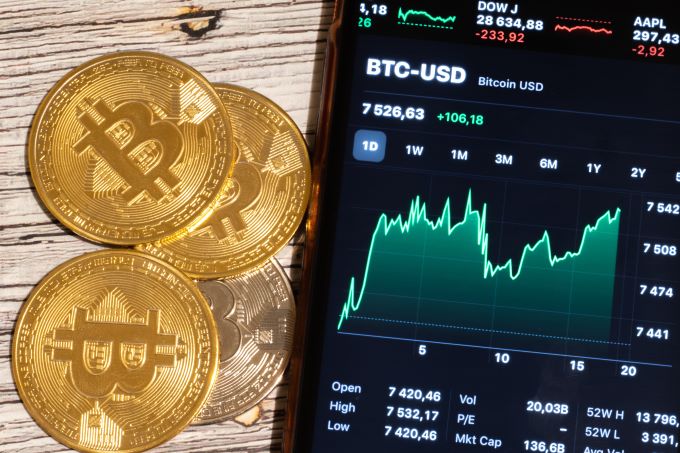
The Bitcoin market initially fell during the trading session on Wednesday, reaching down below the 50-day EMA yet again.
The GBP/USD has bounced back from its lowest level yesterday as the market reflects on the recent data from the UK.
The BTC/USD pair is under pressure as sentiment in cryptocurrencies soar.
Direction in the Forex market looks unclear.
Good buying opportunities remain below the current price level.
The USD/JPY's continued bearish performance pushed it towards the 107.87 support, a near 2-month high, before settling around the 108.25 level as of this writing.
After profit-taking helped bring down the price of gold to the level of $1763, and amid pressures on the dollar, the price of gold bounced higher today to the $1788 resistance.
The GBP/USD bounced back to the 1.4000 psychological resistance level before settling around the 1.3910 support level as of this writing.
After the recent bullish waves of the EUR/USD, which pushed it towards the 1.2080 resistance level, the pair is stabilizing around the 1.2030 level as of this writing.
The USD/CAD has produced a solidly consistent choppy swirl of trading the past month and short-term speculators may find a chance to wager.
The USD/BRL remains within the midst of a value range which is consolidated and offers traders with patience an opportunity to speculate.
The USD/ZAR remains transfixed within the lower depths of its value range, but a tight range the past few days of trading has emerged.