The euro initially fell on Wednesday but found buyers after the inflation number came out.
Technical Analysis
The following are the most recent pieces of Forex technical analysis from around the world. The Forex technical analysis below covers the various currencies on the market and the most recent trends, technical indicators, as well as resistance and support levels.


The euro initially fell on Wednesday but found buyers after the inflation number came out.
The British pound was all over the place during the trading session on Wednesday as we continue to see plenty of noise.
The S&P 500 gapped lower to kick off the trading session on Wednesday but turned around as Wall Street started its narrative-building machine after a higher than anticipated inflation number was printed.
The West Texas Intermediate Crude Oil market went back and forth on Wednesday as we continue to see a lot of noisy behavior in general.
The US dollar pulled back a bit against the Canadian dollar Wednesday as we continue to see a lot of noise near the 1.30 level.
The GBP/USD pair moved sideways even after the extremely hawkish statement by Andrew Bailey of the Bank of England.
The EUR/USD pair declined to the parity level after the latest strong consumer inflation data from the United States and Germany.
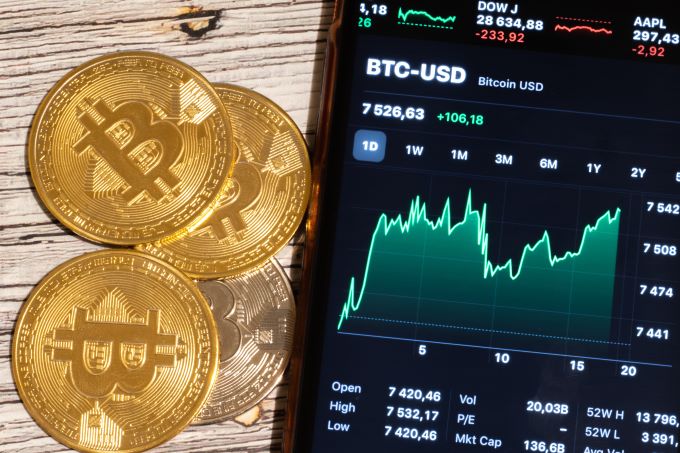
The BTC/USD price continued to consolidate as investors waited for a catalyst and as the US dollar continued its bullish momentum.
While the trading on the NASDAQ 100 has produced better results since the middle of June, this has not stopped nervous choppy conditions.
As of this morning the USD/ZAR is trading near the 16.97000 mark in relatively consolidated action.
The Bitcoin price began to fall again over recent days as risk sentiment deteriorated in the markets, which usually causes a selloff in Bitcoin.
The US dollar has pulled back a bit against the Japanese yen during the trading session on Tuesday as we continue to see a lot of back-and-forths.
Gold markets initially tried to rally during the trading session on Tuesday, but gave bank gain to show signs of weakness yet again.
The Australian dollar has bounced a bit on Tuesday as we have seen a huge move in favor of the greenback against almost everything.
The S&P 500 has gone back and forth during the course of the trading session on Tuesday as we see a lot of very noisy trading.