


Fundamental Backdrop and Market Sentiment
I wrote on 25th October that the best trades for the week would be:
Short of the EUR/USD currency pair below $1.1300. This pair fell over the week by 0.39%.
Long of Bitcoin following a daily close above $87,293. This did not set up.
The total win of 0.39% averaged 0.20% per asset.
A summary of last week’s most important data in the market:
US Federal Reserve Policy Meeting – a barely hawkish rate hold
US Core PCE Price Index – as expected
US Advance GDP – higher than expected at 3.4%, which might be a bit bullish for the USD
European Central Bank Policy Meeting – a slightly dovish tilt on the path of future rate hikes
Bank of Japan Policy Meeting – a hawkish rate hold, as expected, but with a surprising acceleration in balance sheet tightening and an absence of dovish dissent.
Bank of Canada Policy Meeting – the 0.25% rate hike was seen as likely, but there were hawkish surprises in revised forecasts expecting both higher inflation and economic growth, making future rate hikes more likely.
Reserve Bank of New Zealand Policy Meeting – this was the big surprise of the week, with a highly unexpected rate hold even with inflation firmly above the Bank's target rate. The vote was very narrow and even the members wanting to hold said it was just to give more time to see if earlier hikes would work to reduce inflation. The NZD reacted by dropping sharply.
Australian Inflation – this was fractionally higher than expected, giving a very marginal hawkish surprise.
UK Budget – there were no significant surprises.
Last week was an important one in the Forex market, with five major central banks holding policy meetings.
Financial markets ended last week in a risk-off mood, as doubts about the returns on enormous artificial-intelligence investments overtook earlier enthusiasm for technology earnings. The S&P 500 Index fell 1.8% on Friday, finishing the week approximately 0.6% lower—an apparently modest weekly decline that concealed a sharp reversal, with a close below the neckline of a bearish head and shoulders chart pattern. Bitcoin also suffered, losing roughly 4% over the week as news of a massive Binance hack compounded the broader retreat from speculative assets. Together, these moves suggested investors were becoming less willing to overlook valuation and execution risks.
Top Regulated Brokers
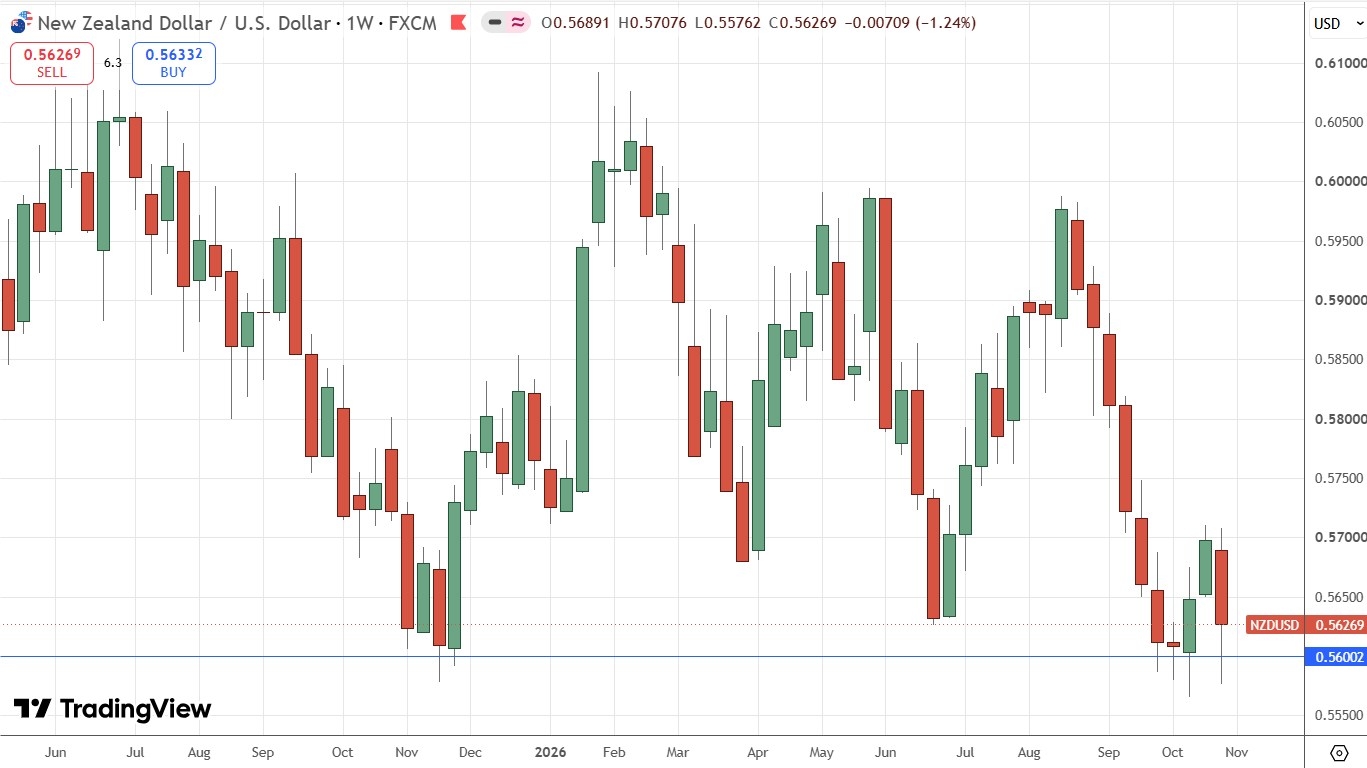
In the Forex market, the Euro slipped by roughly 0.4% against the US dollar over the week, ending near $1.1160, as the ECB’s expected hold offered little fresh support. The New Zealand Dollar faced a much clearer domestic shock: the RBNZ unexpectedly held its cash rate at 2.75% rather than delivering the widely anticipated hike, sending NZD/USD below 0.5600 immediately after the announcement. That was a repricing of the expected timing of tightening, rather than the abandonment of it—the RBNZ continued to signal that higher rates would probably be needed.
Crude Oil remained driven by Middle East supply risks: an attack on a tanker in the Strait of Hormuz helped lift prices by more than 2% on Friday, although WTI finished approximately flat over the week. Gold, meanwhile, fell roughly 3%, breaking well below $4,000 and failing to provide its customary counterweight to falling equities. The uncomfortable connection was that expensive crude oil sustained inflation concerns and expectations of further interest-rate increases, weighing on non-yielding bullion even as investors worried about growth. This was therefore not a straightforward flight into havens, but a market struggling simultaneously with inflation risk and weakening confidence in its leading growth story.
Finally, it should be noted that an election in Israel last week, and the US mid-term elections this coming Tuesday, will open a political window as soon as 4th November for a potential US/Israeli strike on Iran, which might be short but would very likely lead to a spike higher in the price of crude oil.
The Week Ahead: Key Data and Events to Watch
Next week looks likely to be another one with a lot of action, with non-farm payrolls in the USA, central bank policy meetings, and the US mid-term Congressional elections which are expected to end in Democratic control of both Houses. The coming week’s most important data points, in order of likely importance, are:
US Average Hourly Earnings
US Non-Farm Payrolls & Unemployment Rate
Bank of England Policy Meeting
Reserve Bank of Australia Policy Meeting
US Congressional Elections
New Zealand Unemployment Rate
New Zealand Parliamentary Elections
Monthly Forex Forecast: November 2026 Overview
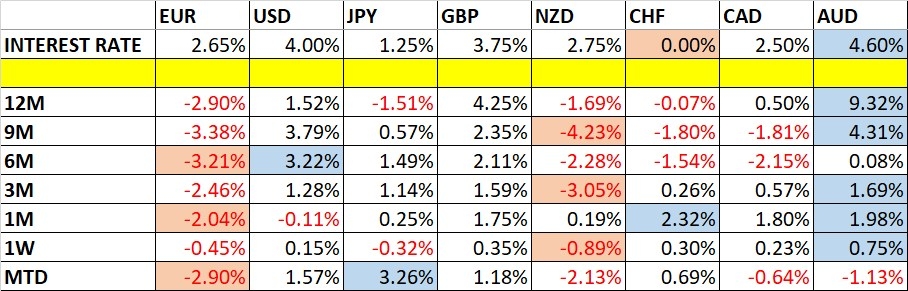
For the month of October, I forecasted that the EUR/USD currency pair will decline in value. Here is the final performance:

For the month of November, I maintain my short EUR/USD forecast.
Weekly Forecast 1st November 2026
This week, I forecast that the EUR/AUD currency cross will rise in value.
Surprisingly, Volatility remained flat last week, with 26% of the notable currency pairs and crosses moving by more than 1% in value. Next week’s volatility is likely to be at a similar level, or maybe a little lower.
You can trade these forecasts in a real or demo Forex brokerage account.
Technical Overview and Key Levels
Key Support and Resistance on Major FX Pairs
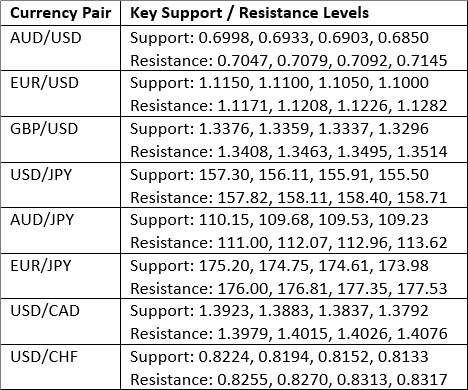
Key Support and Resistance Levels
US Dollar Index
The US Dollar Index (DXY) printed a bearish pin candlestick, which gave up much of its earlier gain after failing to make a new long-term high. Although the candlestick might be interpreted as bearish, it might not be. The price remains within a long-term bullish trend and within an ascending price channel as evidenced by the rising linear regression analysis within the price chart below.
Another potentially bullish factor is that the support level at 101.39 continues to survive.
If the price holds up above 101.39 as we head into the next week, that will be a sign that the bullish trend will be likely to resume, if it does not, we may have seen a top, or, at least be due a deeper bearish retracement.
The situation with the US Dollar has become fundamentally weaker, with a lower expectation of rate hikes and falling 10-year treasury yields.
I still think it makes most sense to be prepared to be long of the USD this week, if the DXY is above 101.39, especially if it holds above that level over the first few days of next week. Overall, though, I would not get hung up on what the USD is doing, and focus on opportunities elsewhere, even if they are priced in USD.
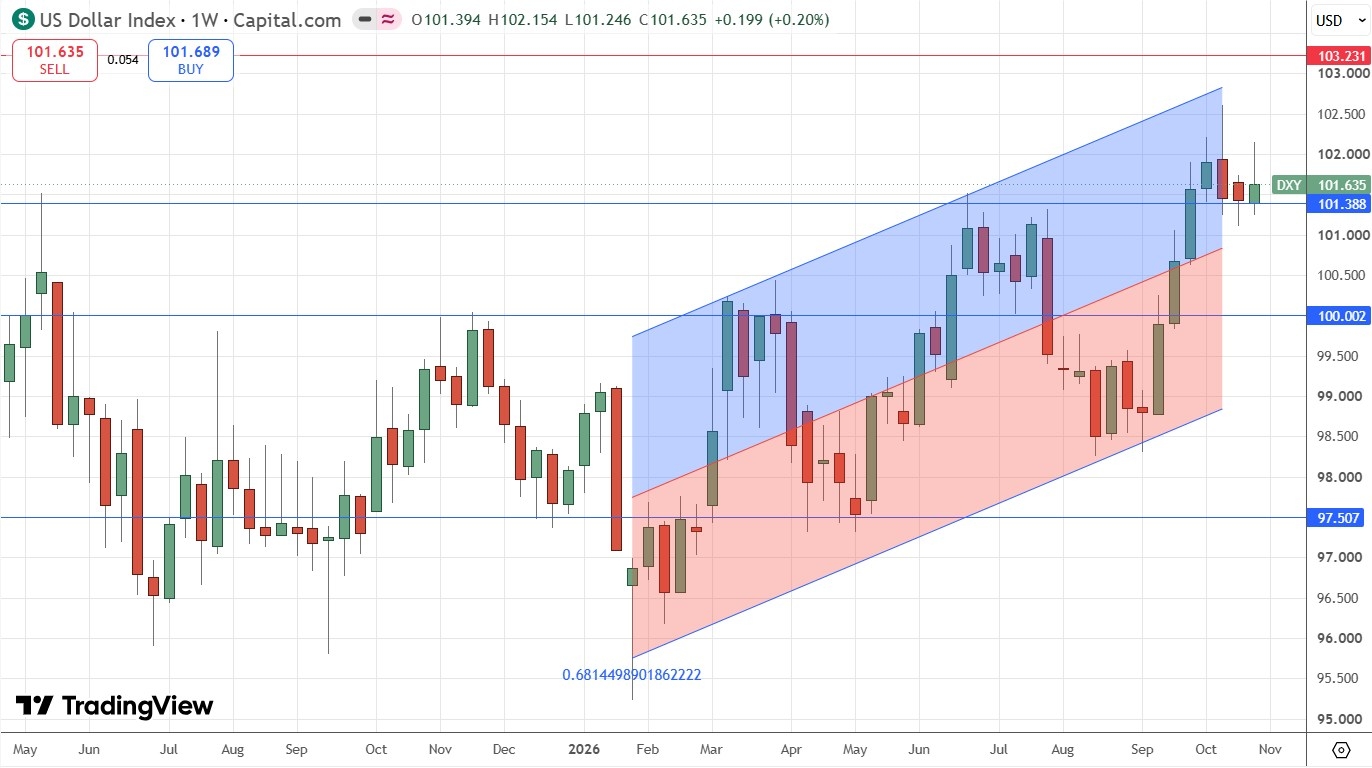
US Dollar Index Weekly Price Chart
EUR/USD
The EUR/USD currency pair fell last week, printing a bearish candlestick, but it also printed a significant lower wick which rejected the support level of 1.1150 and almost rejected the round number at 1.1100 as well.
The price is obviously in a long-term bearish trend, making a new 17-month low, but the price action is beginning to suggest a slowing of bearish momentum, which has been unusually strong lately by the standards of this currency pair.
The technical picture is clearly bearish but the fundamental picture is less so, with the USD losing ground over the past two consecutive weeks. However, the Euro is looking weak, and was the only major currency except for the greenback to take a loss last week. There are fears over French and Eurozone debt, an energy crisis, conflict with Russia, and the riots and demonstrations centred on France but spreading to other Eurozone countries too are all taking their toll on the Euro.
There might be a lot of action and volatility in this currency pair over the coming week, with central bank meetings concerning both the EUR and the USD due.
I will remain in my short trade until we get a daily close above 1.1300. It is quite possible that the price will rise above this area and then turn bearish again, and if that happens, it could be an opportunity to enter a new short trade if that price action sets up. However, I think we are likely to see consolidative or weakly bearish price action this week, so I am comfortable remaining short, especially as this currency pair has historically tended to trend very reliably.
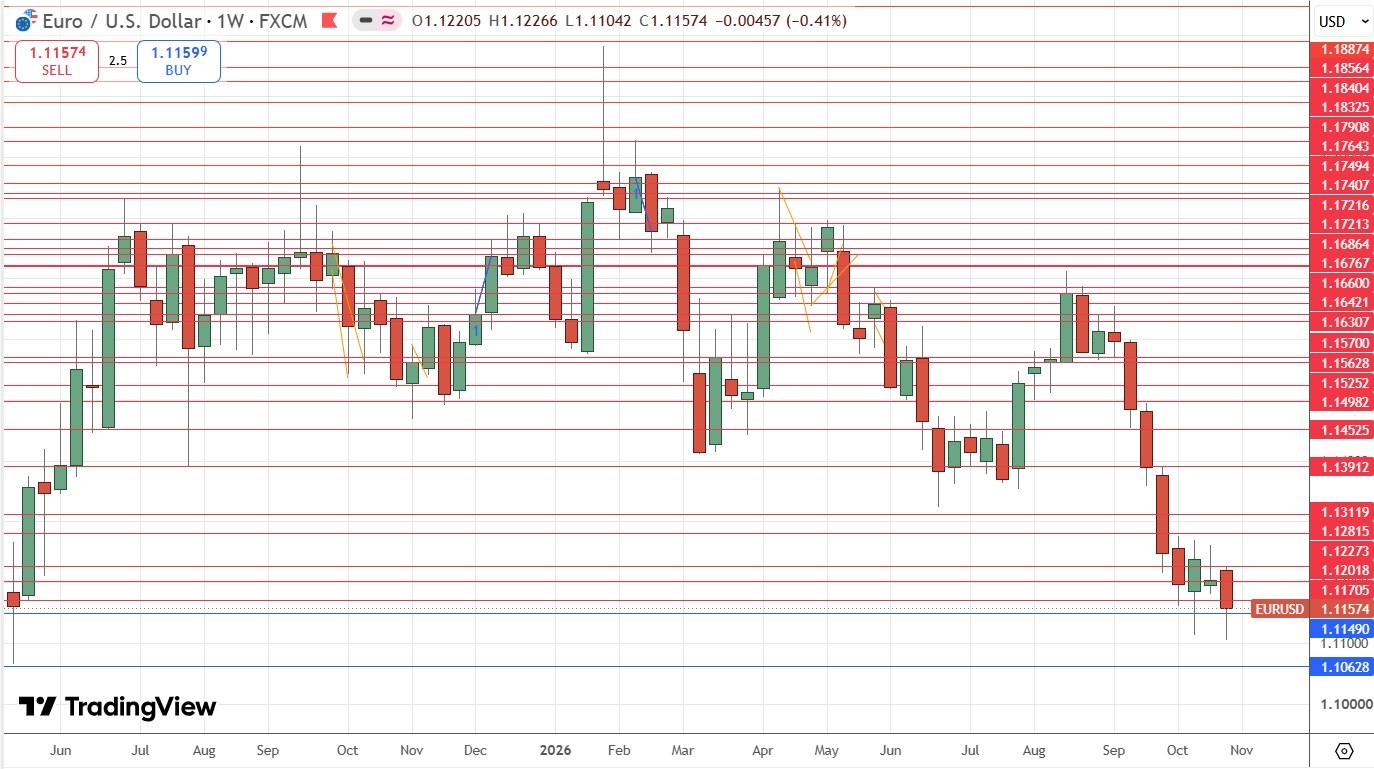
EUR/USD Weekly Price Chart
NZD/USD
The NZD/USD currency pair fell last week, driven lower by the surprise interest rate hold at the Reserve Bank of New Zealand, combined with what is widely seen as unacceptably high inflation. However, it is worth noting that the weekly price chart below shows a significant lower wick. This becomes even more significant when you notice it rejected a round number at $0.5600 which has acted as strong support for a long time.
If $0.5600 continues to hold, although it feels counter-intuitive, there could be a long-term buying opportunity here, if markets can get used to the rate hold without the price making a decisive breakdown below that level.
NZD/USD Weekly Price Chart
WTI Crude Oil
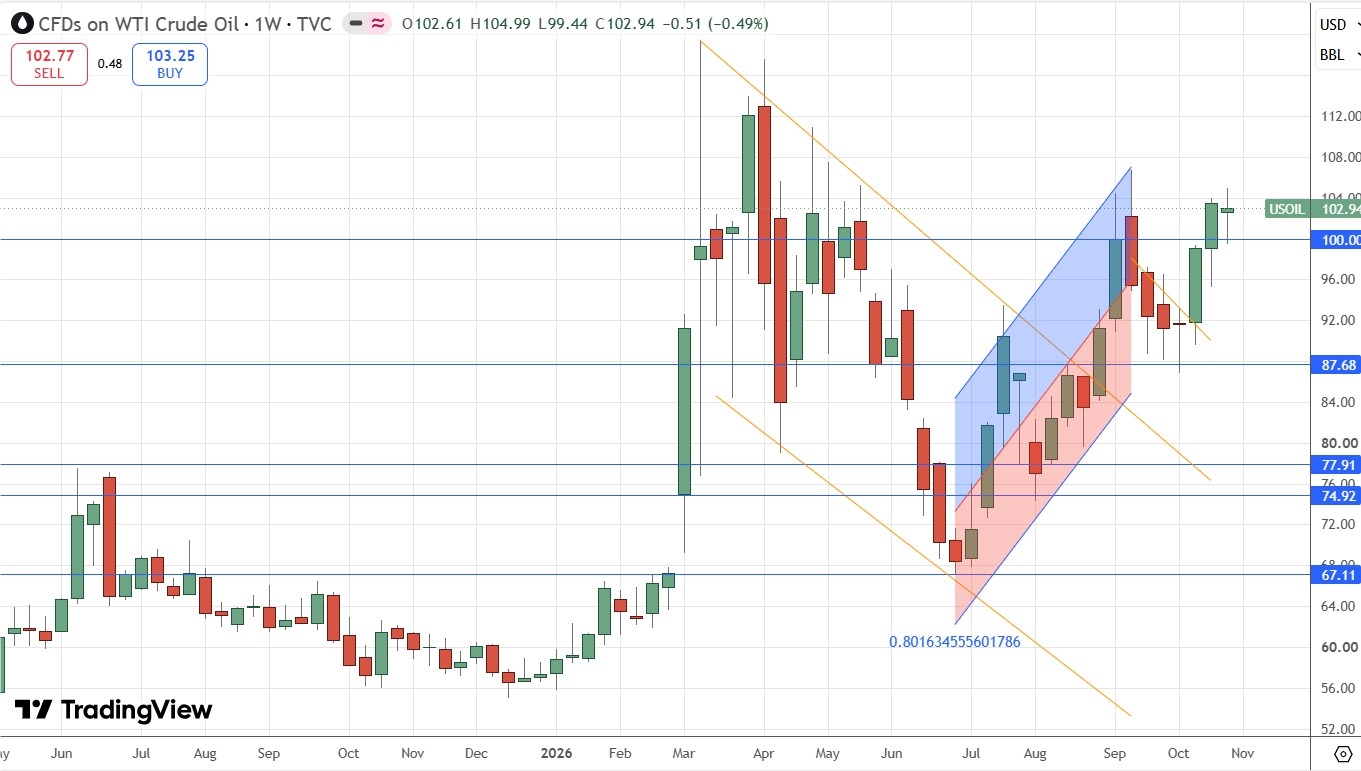
WTI Crude Oil rose again over the past week, and the big round number at $100 held as support. The price briefly traded at a new 5-month high above $104. Another bullish factor – there is clearly a long-term bullish trend – is the ascending linear regression analysis that has almost contained the recent weeks of price rises.
As has been the case for many months, what happens militarily and geopolitically in the Strait of Hormuz and in the Gulf is the main driver here, making trading unpredictable. However, there is increasing talk of trump launching further strikes on Iran after the US mid-term Congressional elections have concluded this Wednesday. It is also worth noting that there was an election in Israel last week in which PM Netanyahu lost his majority, and if the bitterly divided opposition can agree (which is unlikely), they will unseat him from office within a few weeks. A more realistic scenario is a rematch election in February or March 2027, with Netanyahu remaining in office as a caretaker, and he will be keen to resume strikes on Iran for electoral purposes, as well as his sincere and true belief that Iran poses as existential threat to Israel.
Even if Trump does authorize a kinetic resumption of the war, he will be keen to prevent the price of Crude Oil from rising significantly higher, but he might have to accept $120 for a while. If so, long traders might have an opportunity here soon, but this is fraught with risk and timing will be everything.
President Trump will also very likely have to contend with Democratic control of the House and Senate after the election on Tuesday, but the new members will not be sworn in until January 2027, so he has a window where he will be able to act relatively unhindered. Even a Democratic Senate probably will not be able to stop him from taking military action.
I am prepared to go long if we see a new 6-month high at a daily close.
WTI Crude Oil Spot Weekly Price Chart
S&P 500 Index
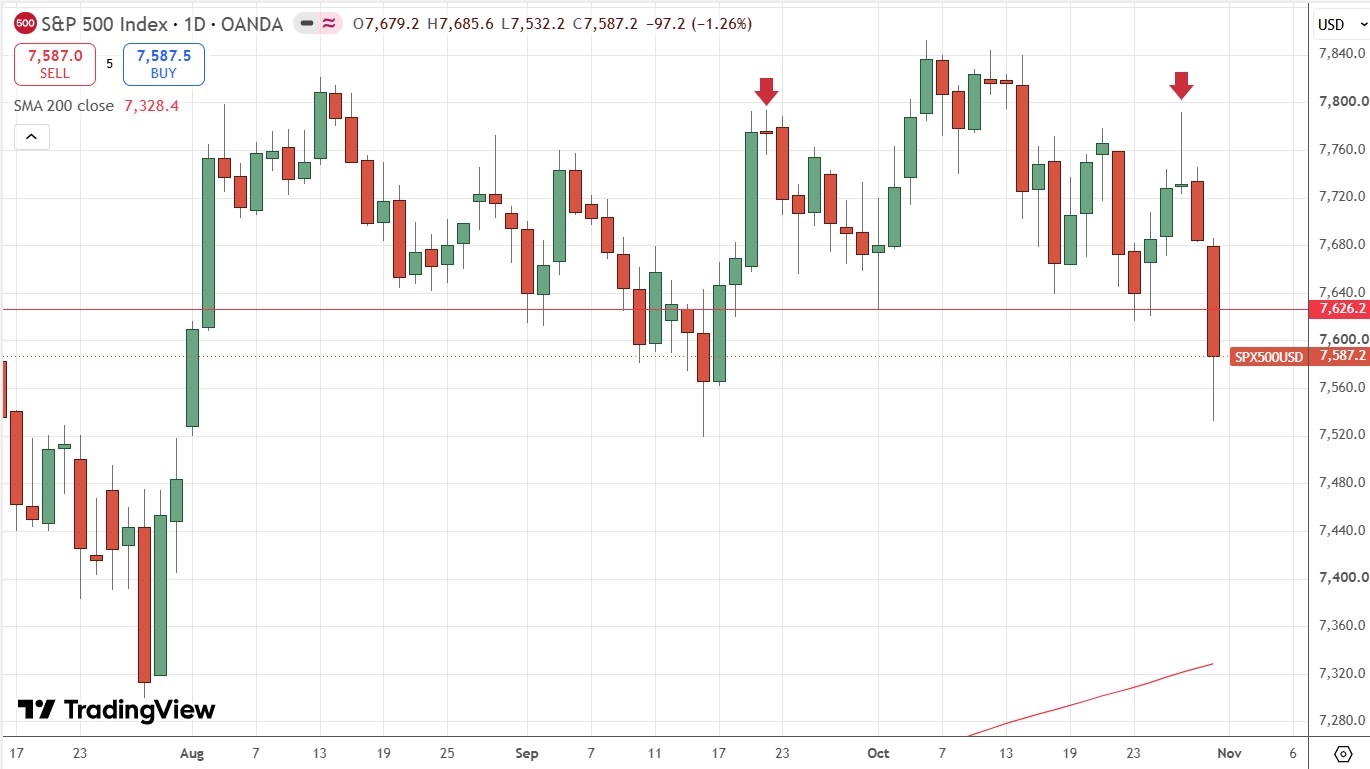
The S&P 500 Index has just made its third consecutive down week after getting close to testing its all-time high above 7800. What is bearishly significant about this is the bearish head and shoulders patter which just completed, with a break below the neckline which I have drawn within the price chart below at 7626.2. Another bearish factor is that the price closed below the round number at 7600.
The next major round number at 7500 is in sight, as is the 200-day simple moving average which currently sits at 7330 and is rising.
It is usually very challenging to profitable short this major US stock market index and even now this is probably still true. However, it could be wise to exit or at least significantly reduce any long positions. I will close some of my long-term buys in this Index on Monday, and then more if we get a daily close below 7500, and then almost all the rest of it if we get a daily close below the 200-day simple moving average.
There is risk-off sentiment gripping markets, risk assets declining everywhere, a potential AI bubble which could burst at any time, and the prospect of a resumption of kinetic war between the USA and Iran. There is also a widespread belief that stock markets are overvalued. Combine all this with the recent bearish price action and we get a bearish outlook.
On the other hand, if we get a bullish bounce from a test of 7500 that might kick start a recovery.
S&P 500 Index Daily Price Chart
Bottom Line
I see the best trades this week as:
Short of the EUR/USD currency pair below 1.1300.
Ready to trade our Forex weekly forecast? Check out our list of the berst Forex brokers.