


They key factor dominating markets right now is yesterday's surprisingly strong US inflation (CPI) data, which triggered a sharp gain in US Dollar Treasury Yields and the DXY (US Dollar Index) itself. The key question facing traders in the EUR/USD currency pair remains whether this will breathe new life into the long-term bearish trend as the price approaches long-term lows which have been bullish inflection points. Let's take a closer look.
Top Regulated Brokers
EUR/USD Fundamental/Sentimental Analysis
The Euro’s fundamental outlook remains mixed. Expectations of a December ECB rate increase offer support, as policymakers warn that inflation could remain above 4% at year-end. However, energy-driven inflation also threatens European growth, creating a difficult trade-off: tighter policy may support the currency’s yield appeal while further restraining economic activity.
The US dollar’s fundamental outlook retains a near-term bullish bias, as persistent inflation strengthens expectations of further Federal Reserve tightening. Fed Governor Christopher Waller raised the possibility of a 50-basis-point December hike before the US CPI release; the subsequent stronger-than-expected figures—headline inflation of 0.4% month-on-month and core inflation of 0.3%—then reinforced the case for tighter policy. Higher Treasury yields have added to the dollar’s appeal, although substantial tightening expectations are already priced in.
We have a fundamental outlook that weakly favours a further decline in the price.
EUR/USD Technical Analysis
The price is clearly in a long-term bearish trend and is currently trading near its 17-month low. Recent weeks saw a move down in the price with unusually strong velocity by the typical standards of this currency pair, which tends to move slowly with a lot of retracements.
The past month has seen the price range within this trend. We see a lot of strong and persistent selling above 1.1250 which is a bearish sign. However, when the price gets near the lows just above the round number at 1.1100, we get new bullish inflections which drive the price back up. Logically, the technical question seems to be whether we will get a real breakout or breakdown from this range.
We might begin to get an answer if the price can break down below the support level at 1.1150 today.
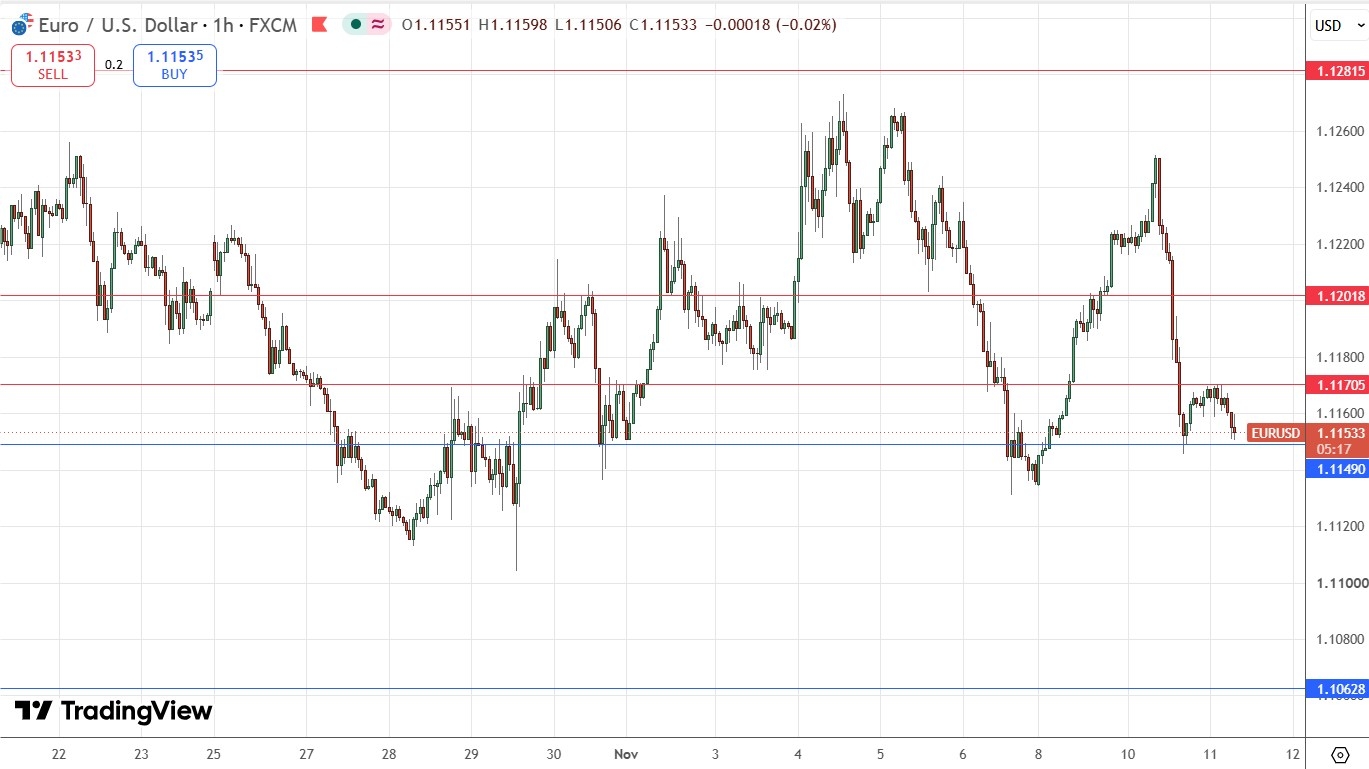
EUR/USD Price Chart – Pivotal Point at 1.1150
My Take on EUR/USD
As a trend follower, I have been short of this currency pair for a while and I remain comfortable with this trade. I feel the directional movement downwards has more impetus behind it, especially with the surprisingly strong US inflation data.
With the pivotal point looking likely to be 1.1150 and the pair's tendency to pull back, I think a short trade from any rejection of resistance levels is the best play here today. A break below 1.1150 followed by a retest from below and another rejection could be a good entry, but then that will run the risk that the range low near 1.1100 might hold.
Another option is to wait for another retracement to the area above 1.1250 and try to find a short trade in that area. This may not set up but would probably be safer.
Review, Support & Resistance Levels
My previous EUR/USD signal on 9th November was not triggered.
Risk 0.75%.
Trades may only be taken prior to 5pm London time today.
Short Trade Ideas
Short entry following a bearish price action reversal on the H1 timeframe immediately upon the next touch of $1.1171 or $1.1202.
Adjust the stop loss to break even once the trade is 20 pips in profit.
Remove 50% of the position as profit when the price reaches 20 pips in profit and leave the remainder of the position to ride.
Long Trade Ideas
Long entry following a bullish price action reversal on the H1 timeframe immediately upon the next touch of $1.1149 or $1.1063.
Put the stop loss 1 pip below the local swing low.
Adjust the stop loss to break even once the trade is 20 pips in profit.
Remove 50% of the position as profit when the price reaches 20 pips in profit and leave the remainder of the position to run.
The best method to identify a classic “price action reversal” is for an hourly candle to close, such as a pin bar, a doji, an outside or even just an engulfing candle with a higher close. You can exploit these levels or zones by watching the price action that occurs at the given levels.
There is nothing of high importance scheduled today concerning either the Euro or the USD. It is a public holiday in the USA today, so liquidity might be low later in the day when the USA comes online.
Ready to trade our daily Forex signals? Here is our list of the best Forex brokers worth reviewing.