


The last few hours have seen some dramatic price movements in most risk assets, driven by the results of the US Congressional elections, which have handed clear wins in both Houses to the Democratic Party. This will have implications for stock markets, cryptocurrencies, and possibly the US Dollar. The price fell strongly on the initial results after a prolonger period of bearish failures, but in recent hours has rebounded strongly. Let's take a closer look at what is going on.
Top Regulated Brokers
BTC/USD Fundamental/Sentimental Analysis
Bitcoin’s strong rebound following the Democrats’ decisive victory in both the House and Senate signals resilience, not a market capitulation to Washington’s political shift. After initially falling to around $75,600, Bitcoin recovered toward $78,000, suggesting buyers see the result as a manageable policy setback rather than a fundamental threat. Democratic control creates a tougher path for Trump’s pro-crypto legislative agenda, including the stalled CLARITY Act, potentially delaying the regulatory certainty sought by institutional investors. Yet the recovery indicates that, for now, relief over the removal of election uncertainty and bargain hunting outweigh those concerns: the immediate sentiment signal is constructive, even as the legislative backdrop becomes less supportive.
The US dollar’s near-term outlook is bearish following the Democrats’ decisive capture of both chambers of Congress, with the Dollar Index falling around 0.6% to a one-month low near 101.27. Markets are pricing in a tougher path for further fiscal stimulus under Trump, while falling Treasury yields and reduced expectations for additional Federal Reserve rate hikes are eroding the greenback’s interest-rate support. Sentiment has also weakened on concerns that greater scrutiny of the AI sector could undermine US growth, although Trump’s veto power limits Democrats’ ability to enact sweeping legislation. The result favours further near-term dollar weakness, but a sustained decline still requires confirmation from softer US economic data and a less hawkish Fed outlook—not congressional gridlock alone.
Fundamentals and sentiment suggest that higher prices are possible.
BTC/USD Technical Analysis
The price recently broke decisively below the major round number support at $80,000 after a period in which Bitcoin was making major technical bullish breakouts to new long-term highs. This suggested that the price might quickly fall to even lower prices, as it consolidated while making a potentially bearish double top at a new lower resistance level at $78,677.
The price took a short-term dive a few hours ago as it became clear that Democrats would easily win both Houses of Congress in the USA's mid-term elections yesterday. However, the last few hours have seen a very strong impulsive bullish move from that fresh low.
Although this looks very bullish, it must be noted that there were no support or resistance levels blocking this move, the nearest one being the resistance at $78,677, which the price is not far from. At the time of writing, there are initial signs that the bullish momentum is slowing as the price gets very close to that level.
Clearly, $78,677 is likely to be today's pivotal point. The impulsive rise shows there are still plenty of buyers our there, but it is not clear yet that they will truly change the technical picture. For that to happen, we need to see a bullish breakout beyond both $78,677 and $80,000.
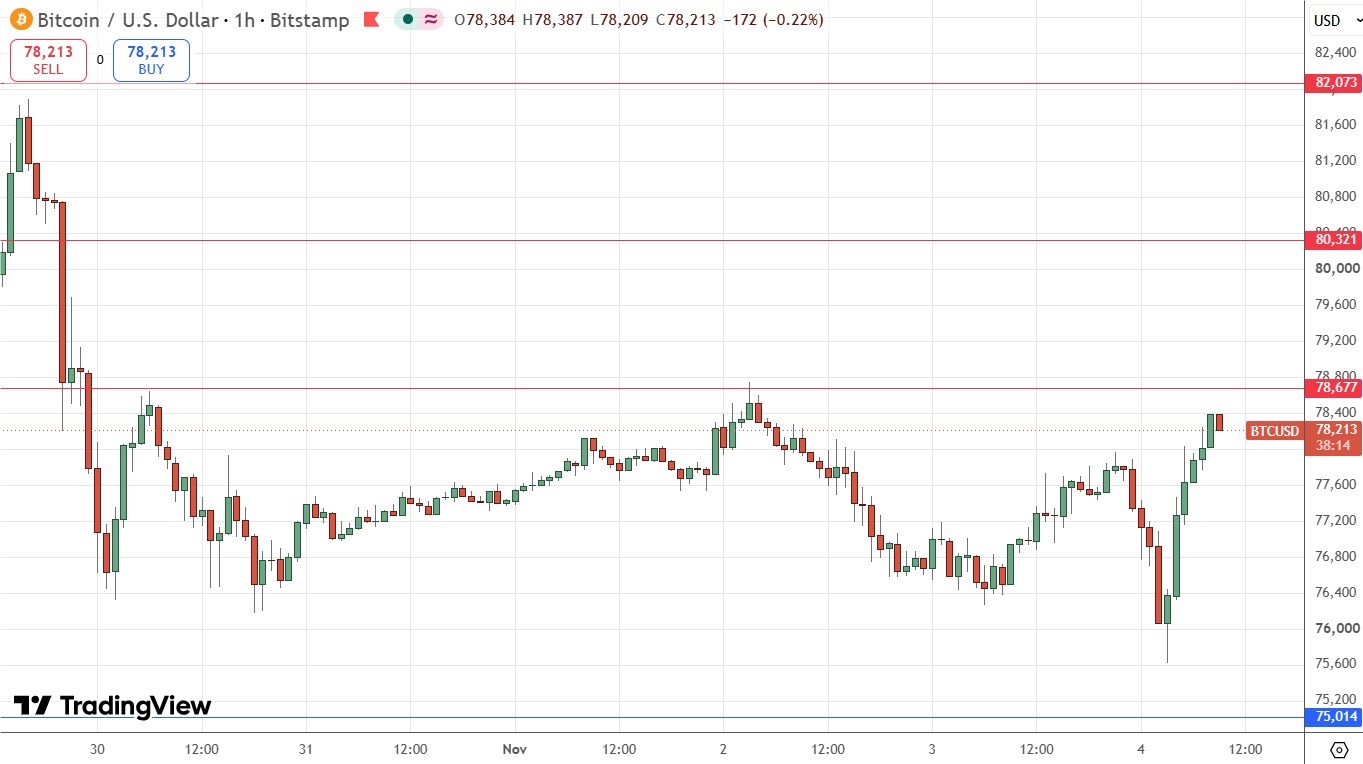
Bitcoin Price Chart – Strong Bullish Move Nears Resistance
My Take on BTC/USD
A daily close above $78,677 will be a bullish sign, printing a very bullish engulfing candlestick. If the daily close is above $80,321, I will be quite confident in a long trade entry with a swing or position trade horizon.
If the resistance at $78,677 is strongly rejected, that will signal that there is still a lot of political analysis to happen before markets can be confident on what the new US Congress might do to Bitcoin and the crypto sector's regulatory prospects.
If the price declines, the support near $75,000 could present a buying opportunity.
Review, Support & Resistance Levels
My previous BTC/USD signal on 29th October was not triggered.
Today’s BTC/USD Signals
Risk 0.25% per trade.
Trades may be taken before 5pm Tokyo time Thursday.
Long Trade Idea
Go long after a bullish price action reversal on the H1 timeframe following the next touch of $75,014.
Place the stop loss $100 below the local swing low.
Move the stop loss to break even once the trade is $100 in profit by price.
Take off 50% of the position as profit when the trade is $100 in profit by price and leave the remainder of the position to ride.
Short Trade Ideas
Go short after a bullish price action reversal on the H1 timeframe following the next touch of $78,677 or $80,321.
Place the stop loss $100 above the local swing high.
Adjust the stop loss to break even once the trade is $100 in profit by price.
Take off 50% of the position as profit when the trade is $100 in profit by price and leave the remainder of the position to ride.
The best method to identify a classic “price action reversal” is for an hourly candle to close, such as a pin bar, a doji, an outside or even just an engulfing candle with a higher close. You can exploit these levels or zones by watching the price action that occurs at the given levels.
There is nothing of high importance scheduled today concerning either Bitcoin or the US Dollar.
Ready to trade our free crypto signals? Here is our list of the top MT4 crypto brokers worth checking out.