


Bearish view
Sell the BTC/USD pair and set a take-profit at 72,760.
Add a stop-loss at 79,000.
Timeline: 1-3 days.
Bullish view
Buy the BTC/USD pair and set a take-profit at 79,000.
Add a stop-loss at 72,760.
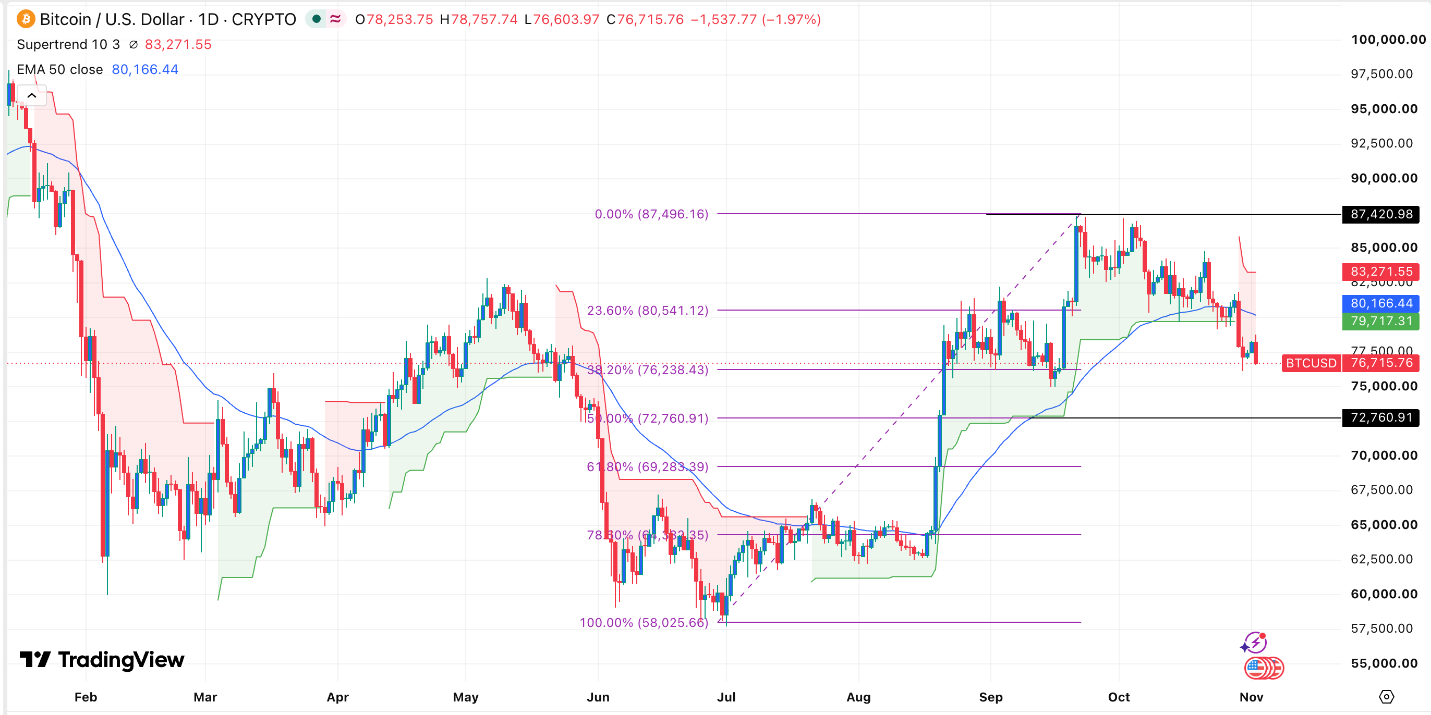
Bitcoin price remained under pressure on Tuesday as investors continued selling the coin following last week’s Binance hack. BTC/USD was trading at 76,765, down by 12.53% from its highest point in September, and technicals suggest that it has more downside to go in the near term.
Top Regulated Brokers
Bitcoin Price Falls as Demand Wanes
BTC/USD pair continued falling on Tuesday as investors remained in the sidelines following last week’s Binance hack. North Korean hackers drained $6.8 billion from the biggest crypto exchange in the world, with the company’s partners freezing $3 billion of it.
After suspending withdrawals following the hack, the company reopened it on Sunday, with its customers pulling cryptocurrencies worth billions of dollars. Still, according to Binance, it also received billions in deposits. The company has also replenished the stolen funds.
The main concern among investors is that no crypto exchange is safe, with experts warning that similar hacks will keep happening in the future. Artificial intelligence and quantum computing will likely contribute to a surge in hacks.
Bitcoin also wavered after Strategy revealed that it acquired 811 coins last week, bringing its total holdings to 849,327 coins. It also repurchased STRC shares worth $208 million.
The next important catalyst for Bitcoin will be the upcoming US midterm elections, which will determine control of Congress. Polls and the prediction market predict that Republicans will will lose the control of both houses. The main implication of all this is that the odds of President Donald Trump signing the CLARITY Act have dropped to near zero.
Bitcoin will also react to some notable macro events from the US. ADP will publish the latest private payrolls data on Wednesday, while the Bureau of Labor Statistics will release the official NFP on Friday.
BTC/USD Technical Analysis
The daily chart shows that the BTC/USD pair has been in a strong downward trend in the past few weeks. It has slumped from 87,420 to the current 76,700.
A closer look shows that it has already moved to the 38.2% Fibonacci Retracement level. It has also slumped below the 50-day Exponential Moving Average (EMA).
Bitcoin has also dropped below the Supertrend indicator, a sign that bears are in control. Therefore, the path of the least resistance is downwards, with the next key target being at the 50% Fibonacci Retracement level of 72,760.
Ready to trade our free Forex signals? Here are the best MT4 crypto brokers to choose from.