


Markets are currently dominated by a strong USD and a kind of risk-off sentiment. Although stock markets have recovered somewhat, most risky assets are heading lower, and Bitcoin is no exception. With the recent two-month low below $73,000 in clear sight today, let's take a deeper dive into what is going on with Bitcoin and whether there might be any attractive trade setups today.
Top Regulated Brokers
BTC/USD Fundamental/Sentimental Analysis
Bitcoin’s fundamental and sentiment outlook remains cautious, as hotter-than-expected US inflation reinforces expectations of further Federal Reserve tightening, weighing on demand for non-yielding risk assets. Persistent outflows from US spot Bitcoin ETFs also point to weakening investment demand, although smaller recent withdrawals suggest selling pressure may be easing. Sentiment remains firmly in “fear” territory.
The US dollar’s fundamental and sentiment outlook remains bullish, supported by stronger-than-expected inflation and increasingly hawkish Federal Reserve expectations. October’s inflation surprise reinforced earlier warnings from Fed officials about further tightening, helping lift the dollar index to around 102.90, its highest level since April 2025. Elevated Treasury yields strengthen the greenback’s relative return appeal, while its broad-based gains suggest sentiment remains firmly dollar-positive. However, with a December rate increase already heavily priced in, further sustained appreciation may depend on expectations of additional hikes into 2027. Softer inflation data or less hawkish Fed guidance could therefore trigger profit-taking, even while the underlying interest-rate backdrop remains supportive.
Fundamentals and sentiment suggest that lower prices are more likely.
BTC/USD Technical Analysis
Bitcoin has seen an acceleration of its bearish trend after breaking down from a gently descending bearish price channel. This is often a technical sign that can work for a short-term trade to ride the increasing momentum.
The price made a fresh 2-month low just a couple of days ago just above the nearest support level at $72,557. The price is again showing short-term bearish price action as it approaches a retest of that area.
It is possible there could be a bullish rebound there, but the way the price sat on the support turned resistance above at $74,465 before finally breaking below it suggests that bears are in the driving seat, as does the recent invalidation of the support level which used to exist below that.
The resistance level at $75,465 looks likely to be very strong, helped by its confluence with the big round number at $75,000.
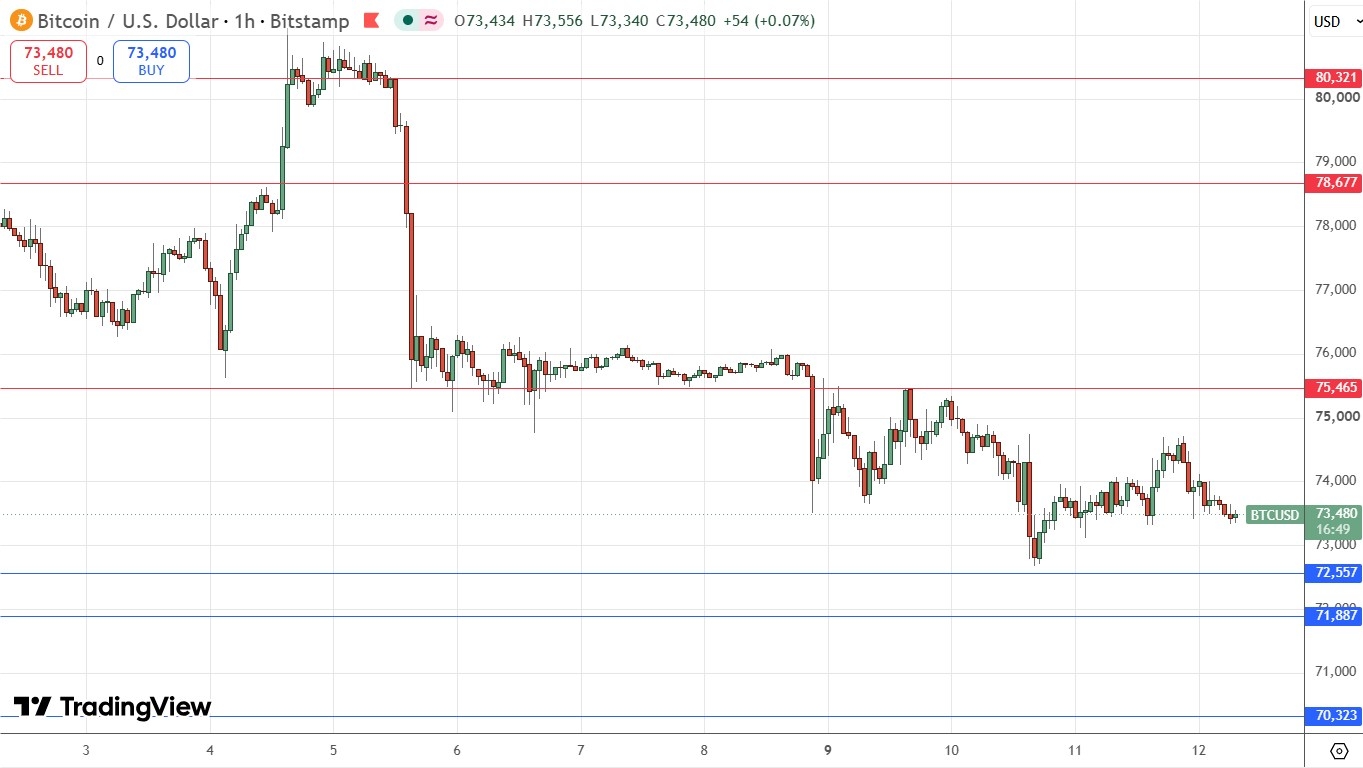
Bitcoin Price Chart – Strong Bullish Move Nears Resistance
My Take on BTC/USD
A long trade, even from a bounce at support, would be a very brave move. I am only interested in short trades. There are two obvious plays – either wait for a potential retracement to the resistance level near $75,000 and take a short there is there is another bearish rejection or wait for a bearish breakdown below $72,557. The problem with the breakdown scenario is that there is another support level close below. I would wait and hope for a retracement to the $75,000 area.
Review, Support & Resistance Levels
My previous BTC/USD signal on 4th November was not triggered.
Today’s BTC/USD Signals
Risk 0.25% per trade.
Trades may be taken before 5pm Tokyo time Friday.
Long Trade Ideas
Go long after a bullish price action reversal on the H1 timeframe following the next touch of $72,557 or $71,887.
Place the stop loss $100 below the local swing low.
Move the stop loss to break even once the trade is $100 in profit by price.
Take off 50% of the position as profit when the trade is $100 in profit by price and leave the remainder of the position to ride.
Short Trade Idea
Go short after a bullish price action reversal on the H1 timeframe following the next touch of $75,465.
Place the stop loss $100 above the local swing high.
Adjust the stop loss to break even once the trade is $100 in profit by price.
Take off 50% of the position as profit when the trade is $100 in profit by price and leave the remainder of the position to ride.
The best method to identify a classic “price action reversal” is for an hourly candle to close, such as a pin bar, a doji, an outside or even just an engulfing candle with a higher close. You can exploit these levels or zones by watching the price action that occurs at the given levels.
There is nothing of high importance scheduled today concerning either Bitcoin or the US Dollar.
Ready to trade our daily crypto signals? Here is our list of the top MT4 crypto brokers worth reviewing.