


Bearish view
Sell the BTC/USD pair and set a take-profit at 70,000.
Add a stop-loss at 75,000.
Timeline: 1-2 days.
Bullish view
Buy the BTC/USD pair and set a take-profit at 75,000.
Add a stop-loss at 70,000.
Top Regulated Brokers
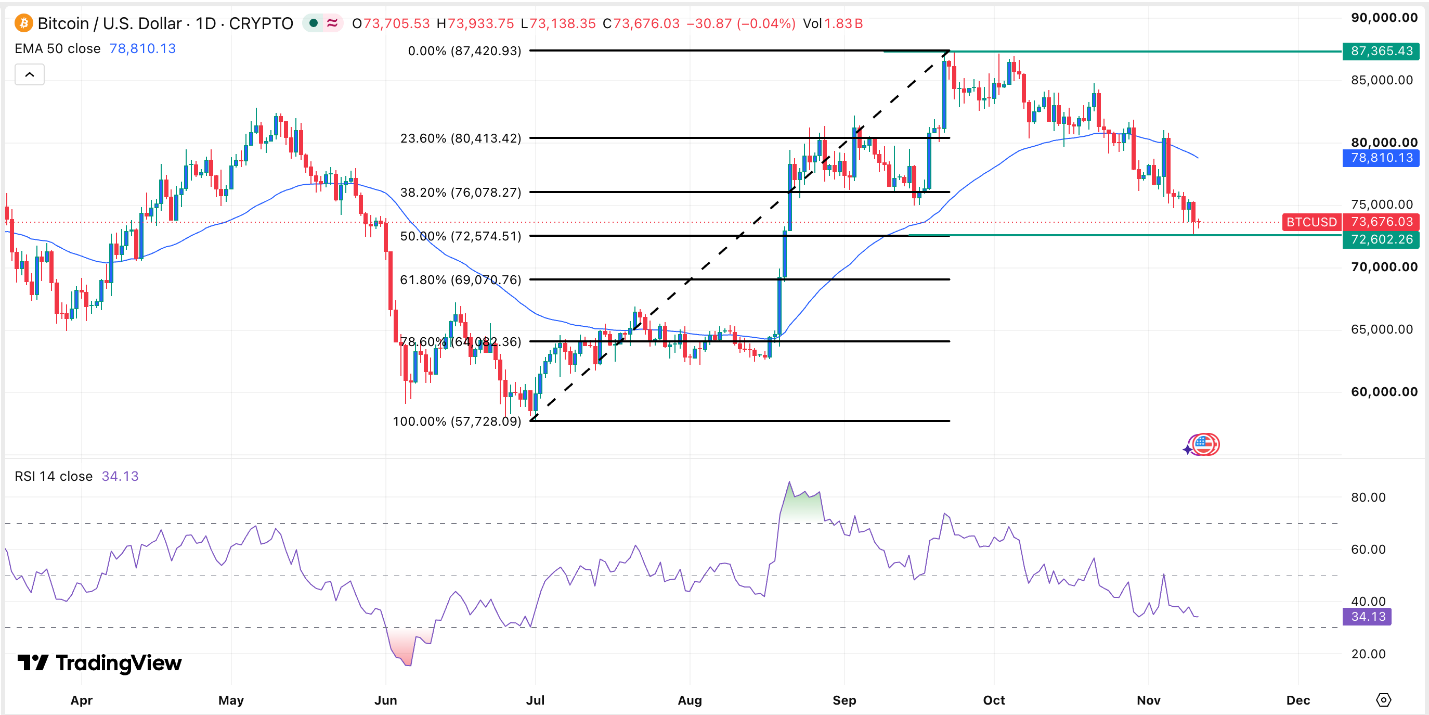
Bitcoin price continued its downward trend as investors rotated from risky assets after the US released strong inflation and jobs numbers. BTC/USD pair moved to a low of 72,600, its lowest level since August this year. It has slumped sharply from the October high of 87,365.
Bitcoin Price Falls as US Inflation Rises
The BTC/USD pair has remained under pressure in the past few days after the US published strong jobs and inflation data. A report released last Friday showed that the economy created 165k jobs last month, while the unemployment rate fell to 4.1%. A strong jobs number is a sign that the economy is doing well.
Meanwhile, another report released by the Bureau of Labor Statistics (BLS) showed that inflation remained high in October. The headline and core consumer inflation numbers came in at 0.4% and 0.3%, respectively. These numbers were higher than the expected 0.3% and 0.2%, respectively.
As a result, there are signs that inflation is still a major thing. As such, there is a likelihood that the Federal Reserve will respond by delivering its second interest rate hike of the year in its December meeting. These numbers explain why US bond yields surged, with the ten-year rising to 5% and the five-year moving to 4.82%.
Bitcoin also retreated as American investors continued dumping their assets. Data shows that the funds shed over $95 million on Tuesday, with most of the outflows happening in the iShares Bitcoin ETF (IBIT). The funds have now lost over $1.5 billion this month, more than triple what they lost last month.
BTC/USD Technical Analysis
The daily chart shows that Bitcoin price has been in a strong sell-off in the past few months. It dropped to a low of 72,602, a few points below the 38.2% Fibonacci Retracement level.
Bitcoin has dropped below the 50-day moving average. The Relative Strength Index (RSI) has dropped and is approaching the oversold level of 30. A falling RSI indicator is a sign that the downward trend is strengthening.
Therefore, the price will likely continue falling, potentially to the support level of 70,000. A move above the resistance level of 75,000 will invalidate the bearish outlook.
Ready to trade our free Forex signals? Here are the best MT4 crypto brokers to choose from.