


King Crypto's latest sell-off has brought the market to a point where extreme investor losses and long-term technical support are beginning to tell two different stories. On-chain indicators suggest that some holders may already have capitulated, while the weekly chart shows the price testing a support structure that held during previous market downturns.
Top Regulated Brokers
Those signals raise the possibility that a bottom is forming, but they do not yet show whether buyers can sustain a recovery. The challenge for buyers is that capitulation measures describe what investors have already endured, not whether enough new demand has arrived to sustain a recovery. Bitcoin’s next move may therefore depend on whether the current support zone absorbs the remaining selling pressure or gives way under another wave of forced exits.
Bitcoin’s Realised Losses Echo Past Bottoms, but Demand Remains Weak
Bitcoin’s decline below $62,000 on Nov. 15 triggered a sharp increase in realised losses, bringing an important on-chain indicator to levels last observed near previous cycle lows. Glassnode’s Week On-chain report said realised losses had reached a threshold seen around market bottoms in 2018, 2020, 2022 and early 2023.
“$BTC fell to $62K this week, and capitulation is underway,” the on-chain data provider said in an X post on Tuesday, adding:
“Realized losses are at a level seen only near past lows.”
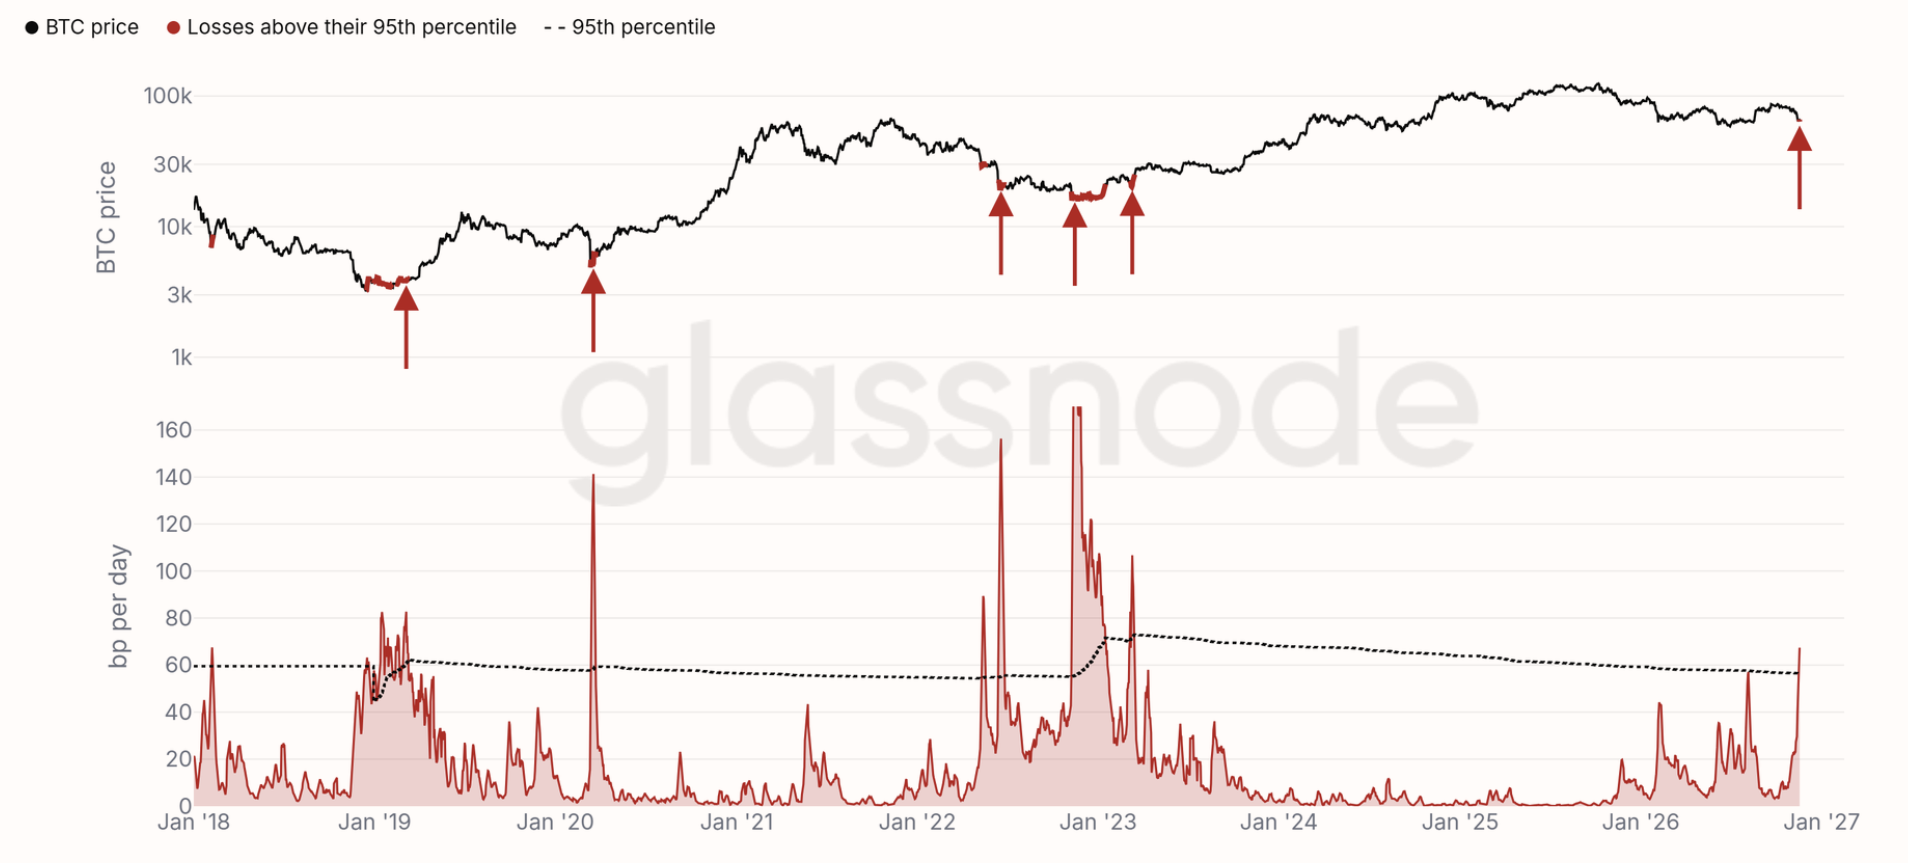
Bitcoin realized losses. Source: Glassnode
Realised losses measure the value of losses investors lock in when they sell Bitcoin below the price at which they acquired it. A sharp increase often reflects capitulation: holders who had been waiting for a recovery eventually decide to exit, transferring their coins to buyers willing to take the other side.
“Spikes like this have marked capitulation, when investors who bought higher give up and sell to whoever will take the other side,” Glassnode added.
CryptoQuant’s latest report provides another indication of the pressure on holders.
Following the latest flush to $62,000, “holders realized a net loss of 25.8K BTC, the largest daily reading since July 13. The sell-off pushed holders to realize losses on a scale last seen in mid-July,” CryptoQuant said, adding:
“These levels of unrealized losses among traders have historically been associated with price bottoming formations, which tend to take at least two months.”
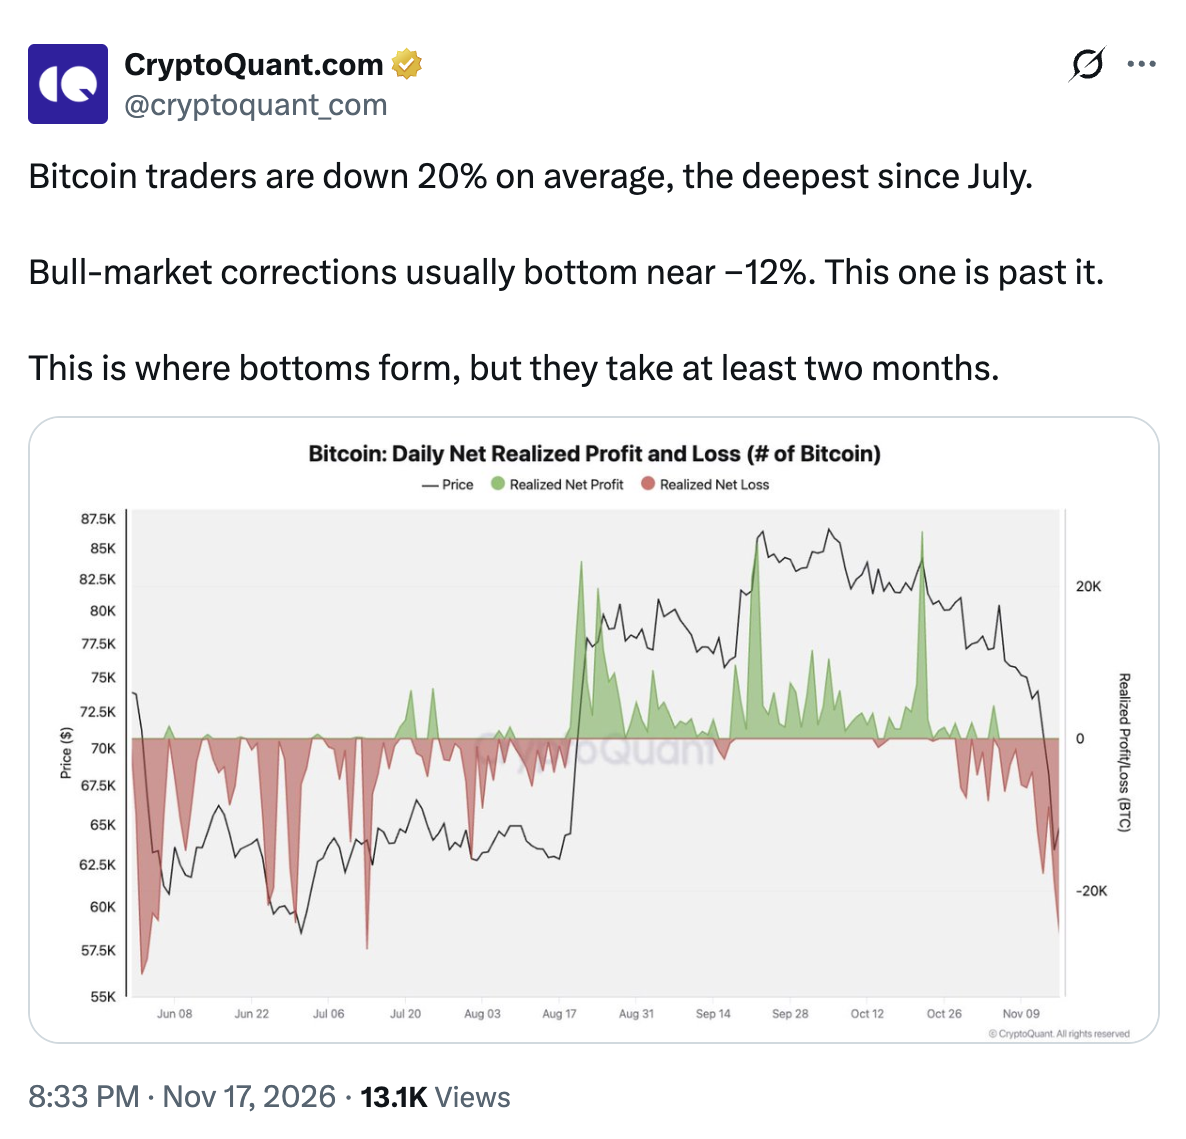
Bitcoin daily net realized profit and loss. Source: CryptoQuant
The report also found that traders’ unrealised profit-and-loss margin had fallen to approximately minus 20%, its most negative level since July 1.
These figures point to a market in which many recent buyers are underwater, and some are choosing to sell rather than wait for prices to recover.
The broader demand picture also remains weak. CryptoQuant reported that Bitcoin's demand growth was contracting, with spot demand leading, the decline and perpetual futures demand turning negative. It also placed its Bull Score Index at 10, indicating extremely bearish market conditions.
This creates a tension in the current setup. Capitulation may have removed some of the weakest holders and reduced speculative positioning, but a durable recovery still requires buyers to replace the demand that is absent at the moment.
Bitcoin Tests Multi-Year Support as Momentum Remains Weak
Bitcoin’s weekly chart offers a second potential bottom signal. Data from TradingView shows BTC testing a rising multi-year trendline that connects macro lows from previous market cycles. The line provided support around the 2020 low and again near the 2022–2023 bottom before Bitcoin entered substantial recovery phases.
The chart below highlights the scale of the subsequent rallies. The rally following the 2020 low measured approximately 1,112%, while the upswing from the 2022–2023 low reached about 715% to the current all-time high above $126,000. These historical moves illustrate why traders are watching the trendline closely as Bitcoin retests it again.
Bitcoin is trading around $64,241 at the time of writing, close to the multi-year support line. The weekly chart also shows the 200-week simple moving average (SMA) near $68,184, the 50-week SMA around $74,468 and the 100-week SMA near $88,384. BTC remains below all three averages, leaving the broader technical structure under pressure.
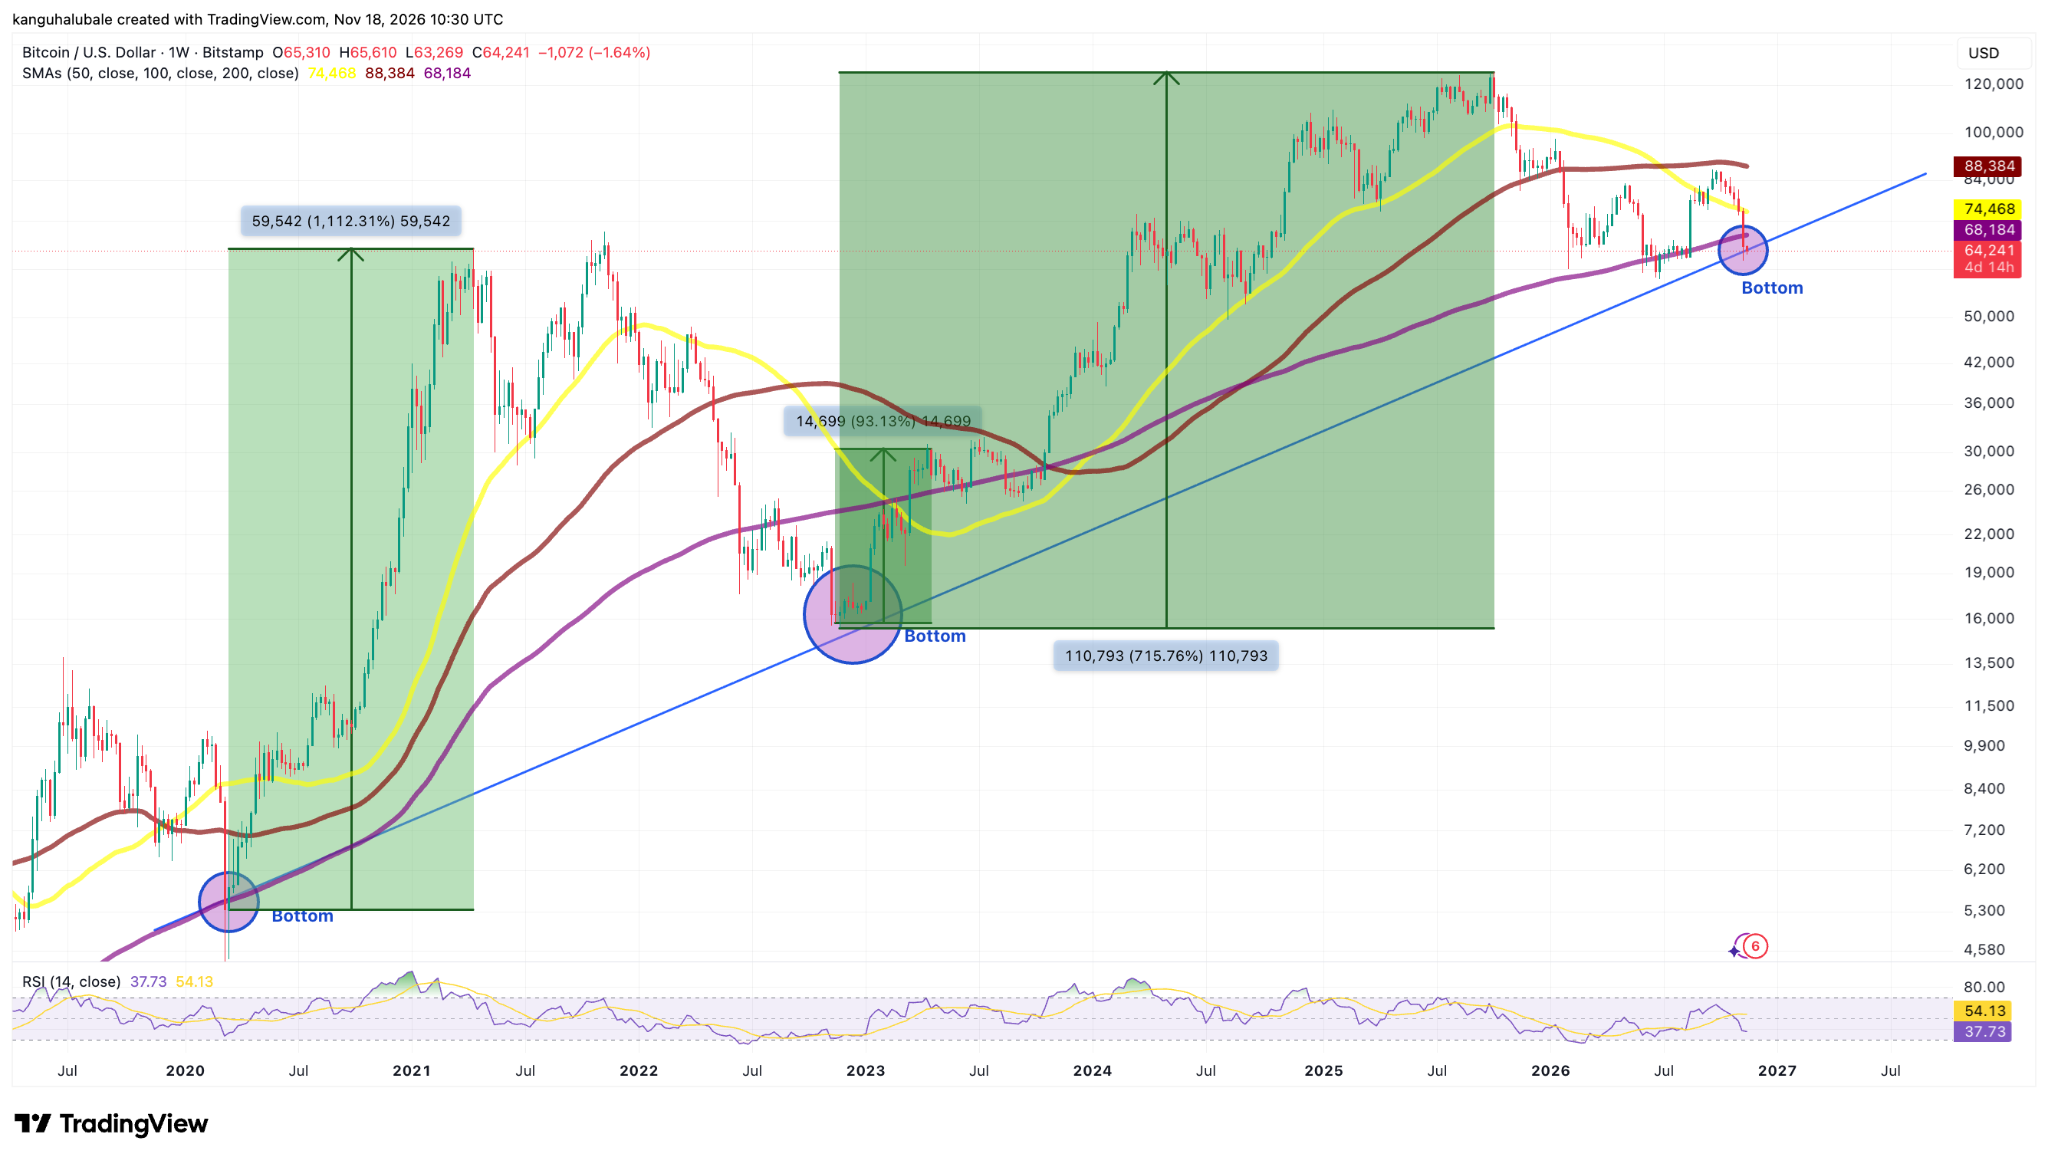
The ascending trendline is therefore an important reference. However, a successful retest would need to be followed by stronger buying, improving momentum and a recovery above important moving averages to support the case for a lasting cycle low.
The weekly Relative Strength Index (RSI) stands near 37.73, below its signal average of approximately 54.13. This indicates that momentum remains weak rather than confirming a bullish reversal. A stabilisation in RSI alongside price holding the trendline would provide a more constructive signal than the trendline test alone.
Why Bitcoin’s $60K–$62K Support Zone Matters for Buyers
Traders are now shifting their focus to the $60,000-$62,000 support area, with Glassnode identifying the broader $62,000-$60,000 range as a significant block of recent buyer accumulation.
Its report said this zone contains roughly one-fifth of short-term holders’ supply and expanded by approximately 66,000 BTC during the two days of heaviest selling. That suggests buyers absorbed a meaningful amount of supply during the downturn.
However, the blockchain analytics firm warned that a daily close below $62,000 could put those August buyers into loss and expose Bitcoin to a faster decline. The next downside reference is the June low around $58,500, followed by Bitcoin’s realised price near $54,000 — the average price at which coins last moved.
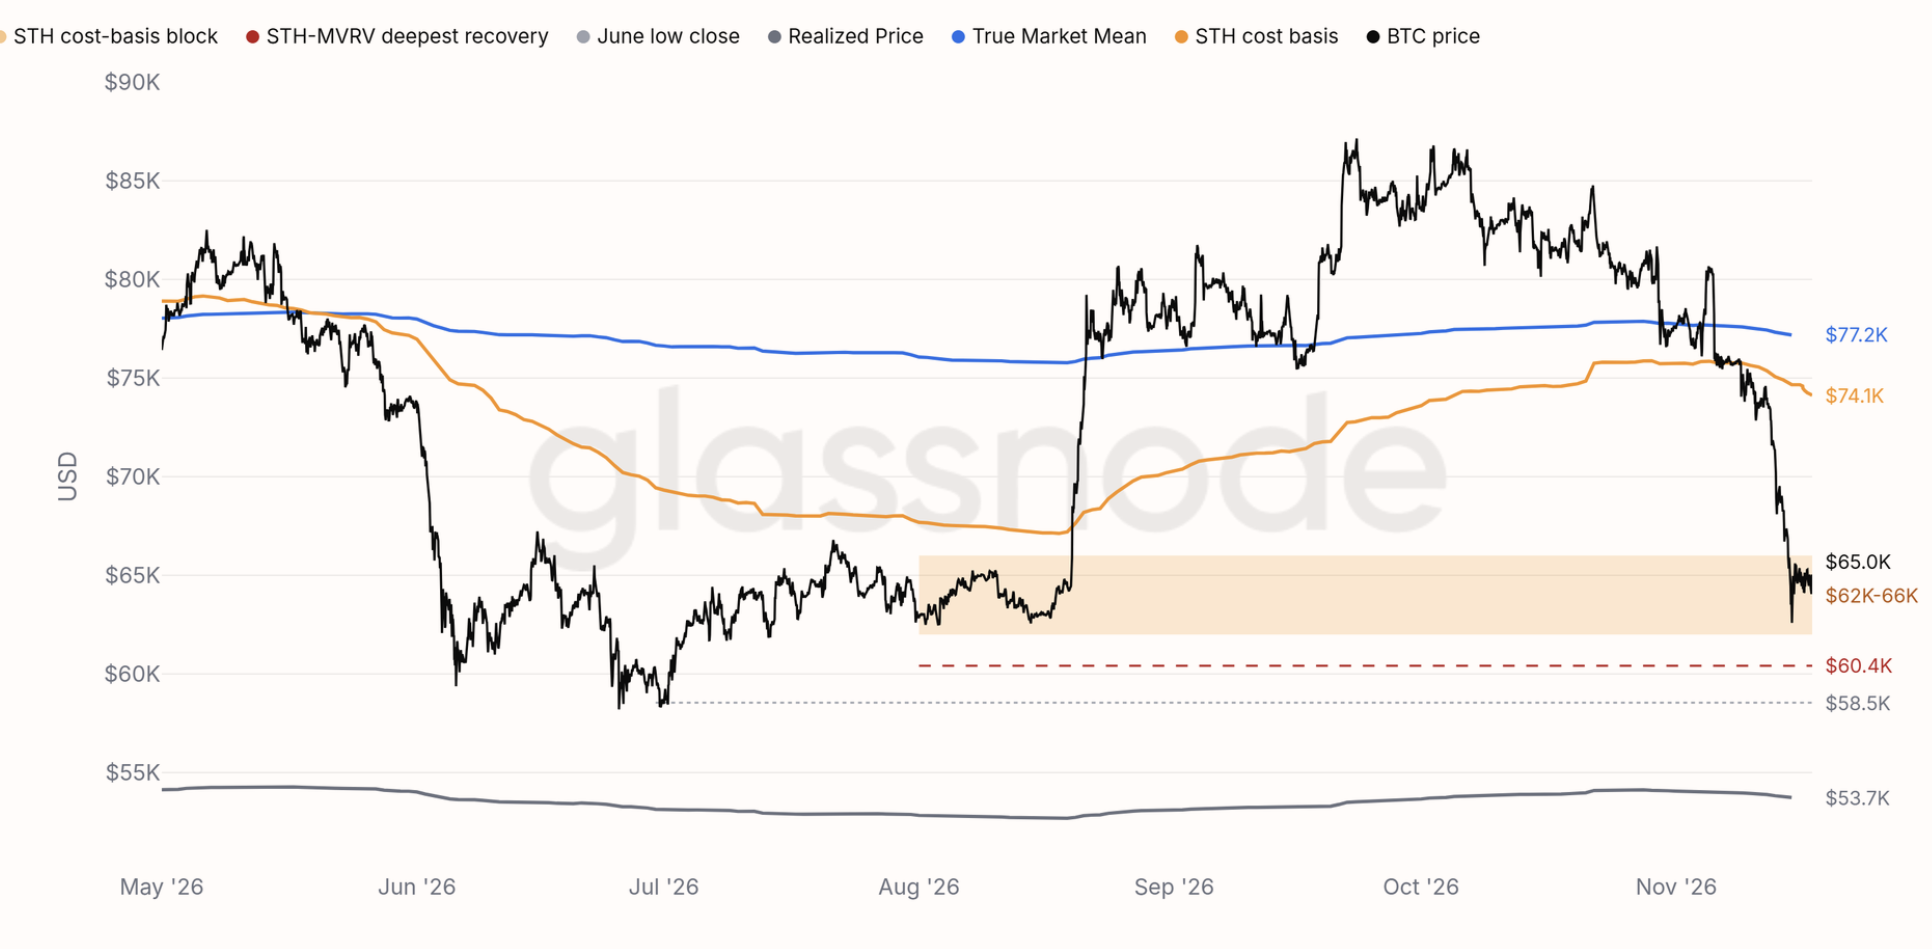
Bitcoin pricing bands. Source: Glassnode
CryptoQuant identified another potential source of support between $62,000 and $65,000. Its on-chain price distribution data showed a large concentration of long-term holder selling in this range, matched by buying from newer investors. This area could therefore act as support if those buyers continue to hold their positions.
The liquidation picture adds another layer. The liquidation heatmap shows that much of the leveraged long positioning above $62,000 were cleared during the recent sell-off. The remaining dense cluster of long liquidations sits lower, between approximately $59,500 and $62,200.
Bitcoin’s Nov. 15 low entered the upper part of this range but remained above its core. A renewed test could trigger another round of forced selling, to lower levels.
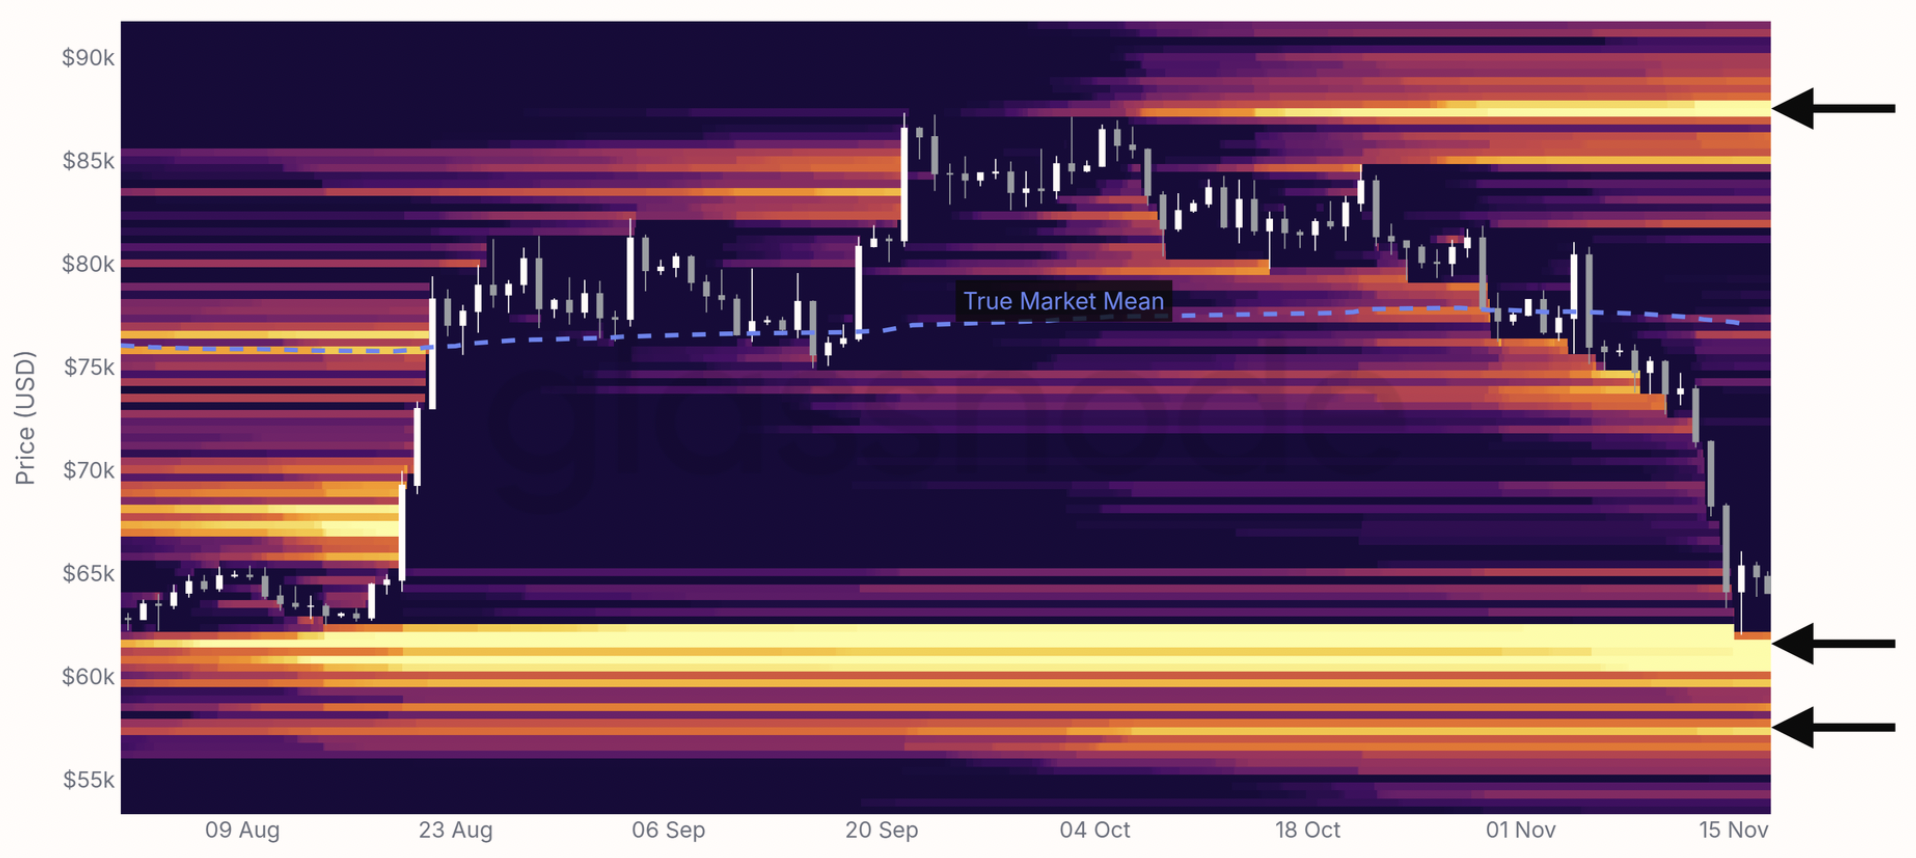
Bitcoin liquidation heatmap. Source: Glassnode
On the upside, the short-term holder cost basis near $74,100 is a level to watch. Glassnode said a recovery above this average would strengthen the evidence that a bottom is forming. Until then, the market remains vulnerable to further selling.
What Would Strengthen the Case for a Bitcoin Bottom?
Bitcoin is displaying several conditions associated with previous market lows: unusually high realised losses, deeply negative trader profitability and a test of a multi-year ascending support line. The $62,000-$66,000 accumulation zone has also absorbed substantial selling, providing evidence that buyers are active at lower prices.
But these signals are not enough to declare the bottom is in. Retail and institutional demand remains weak, BTC trades below major weekly moving averages and a daily close below $62,000 could expose the $58,500 and $53,700 levels. A sustained recovery above the 200-week SMA and, eventually, the short-term holder cost basis near $74,100 would offer stronger confirmation.
For now, the $60,000-$62,000 remains the market’s most important test. Whether it holds, and whether buyers can turn the current capitulation into sustained spot demand, should help determine if Bitcoin is establishing a cycle bottom or entering another correction phase.