





Fundamental Backdrop and Market Sentiment
I wrote on 18th October that the best trades for the week would be:
- Short of the EUR/USD currency pair below $1.1300. This pair fell over the week by 0.32%.
- Long of Bitcoin following a daily close above $87,293. This did not set up.
The total gain of 0.32% averaged 0.16% per asset.
A summary of last week’s most important data in the market:
- UK CPI (Inflation) – slightly higher than expected
- Canada CPI (inflation) – slightly lower than expected
- New Zealand CPI (inflation) – slightly lower than expected
It was a relatively quiet week in the Forex market, with the only high impact data being a few inflation prints which barely deviated from expectations. There was more activity in stocks and commodities.
Top Regulated Brokers
Other major markets had a volatile, mixed week, as concerns about the cost of the AI boom collided with an oil-price surge that revived inflation worries. Investors rotated away from technology shares toward energy, defensive stocks and smaller companies rather than selling equities indiscriminately. Notably, the healthcare sector held up well.
- US stocks: The S&P 500 Index fell by 0.5% and the Nasdaq Composite lost 0.7%, while the Dow gained 0.4% and the small-cap Russell 2000 rose by 2%. The main pressure came from doubts about the financing required for enormous AI investments, with Thursday bringing a particularly sharp technology sell-off. Strong industrial earnings and gains outside tech helped cushion the broader market.
- Europe and Asia: Europe’s STOXX 600 declined about 1.4%, as rising energy costs and political uncertainty in France outweighed some encouraging earnings. Asian technology shares also felt the spillover from Wall Street’s sell-off, although Hong Kong and mainland Chinese benchmarks rebounded on Friday.
- Commodities: Crude Oil was the standout gainer. Brent Crude rose more than 6% over the week to roughly $117 a barrel, while US crude finished above $103. Houthi attacks on Saudi Arabia and fears of wider Middle East supply disruptions drove the rally, with increasing signs that the USA and Israel are preparing to attack Iran again in November. Precious metals moved the other way: Gold lost about 4%, falling below $4,000 an ounce, and Silver dropped by more than 5%, as dollar strength and concerns about interest rates weighed on demand.
- Bitcoin: Bitcoin surrendered its early-week gains and is now very close to making a break below the crucial level at $80,000. It was caught in the same retreat from riskier assets as technology stocks, while roughly $636 million of withdrawals from US spot Bitcoin ETFs on Thursday added selling pressure. Despite that reversal, preliminary figures still showed a modest net ETF inflow for the week overall, even though the price has been descending within a channel.
The Week Ahead: Key Data and Events to Watch
Next week will be a very big week in the market, with several major central bank policy meetings. The coming week’s most important data points, in order of likely importance, are:
- US Federal Reserve Policy Meeting
- US Core PCE Price Index
- US Advance GDP
- European Central Bank Policy Meeting
- Bank of Japan Policy Meeting
- Bank of Canada Policy Meeting
- Reserve Bank of New Zealand Policy Meeting
- Australian Inflation
- UK Budget
Monthly Forex Forecast: October 2026 Overview
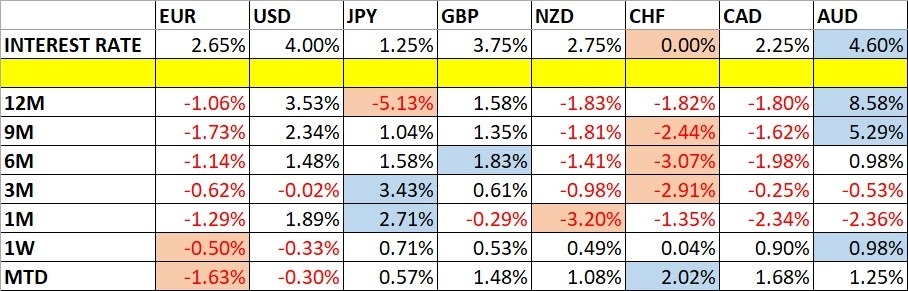
For the month of October, I forecast that the EUR/USD currency pair will decline in value. Here is the performance so far:

Weekly Forecast 18th October 2026
There were no excessive moves in currency crosses last week, so I make no forecast.
Volatility increased last week, with 26% of the notable currency pairs and crosses moving by more than 1% in value. Next week’s volatility is likely to be higher because there are many highly important events due.
You can trade these forecasts in a real or demo Forex brokerage account.
Technical Overview and Key Levels
Key Support and Resistance on Major FX Pairs
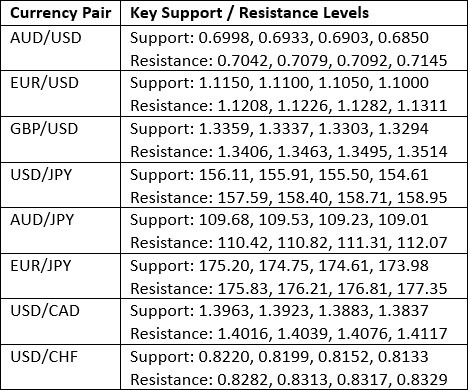
Key Support and Resistance Levels
US Dollar Index
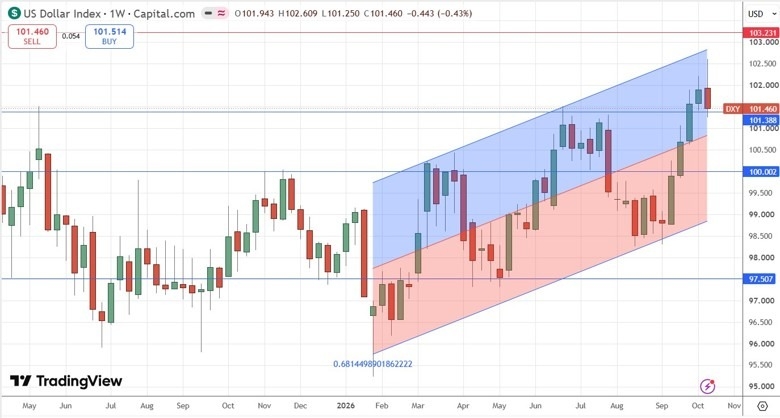
The US Dollar Index (DXY) made a small bearish candlestick, but it found support at the former resistance level of 101.39. Although this looks bearish, it is significant that there is clearly a long-term bullish trend, and that the nearest support level has survived. Further evidence of this trend is produced by the price action remaining contained within the ascending linear regression analysis shown within the price chart below.
If the price holds up above 101.39 as we head into the next week, that will be a sign that the bullish trend will be likely to resume, if it does not, we may have seen a top, or, at least be due a deeper bearish retracement.
The situation with the US Dollar has become fundamentally weaker, with a lower expectation of rate hikes and falling 10-year treasury yields.
I still think it makes most sense to be prepared to be long of the USD this week, if the DXY is above 101.39, especially if it holds above that level over the first few days of next week. Overall though, I would not get hung up on what the USD is doing, and focus on opportunities elsewhere, even if they are priced in USD.
US Dollar Index Weekly Price Chart
EUR/USD
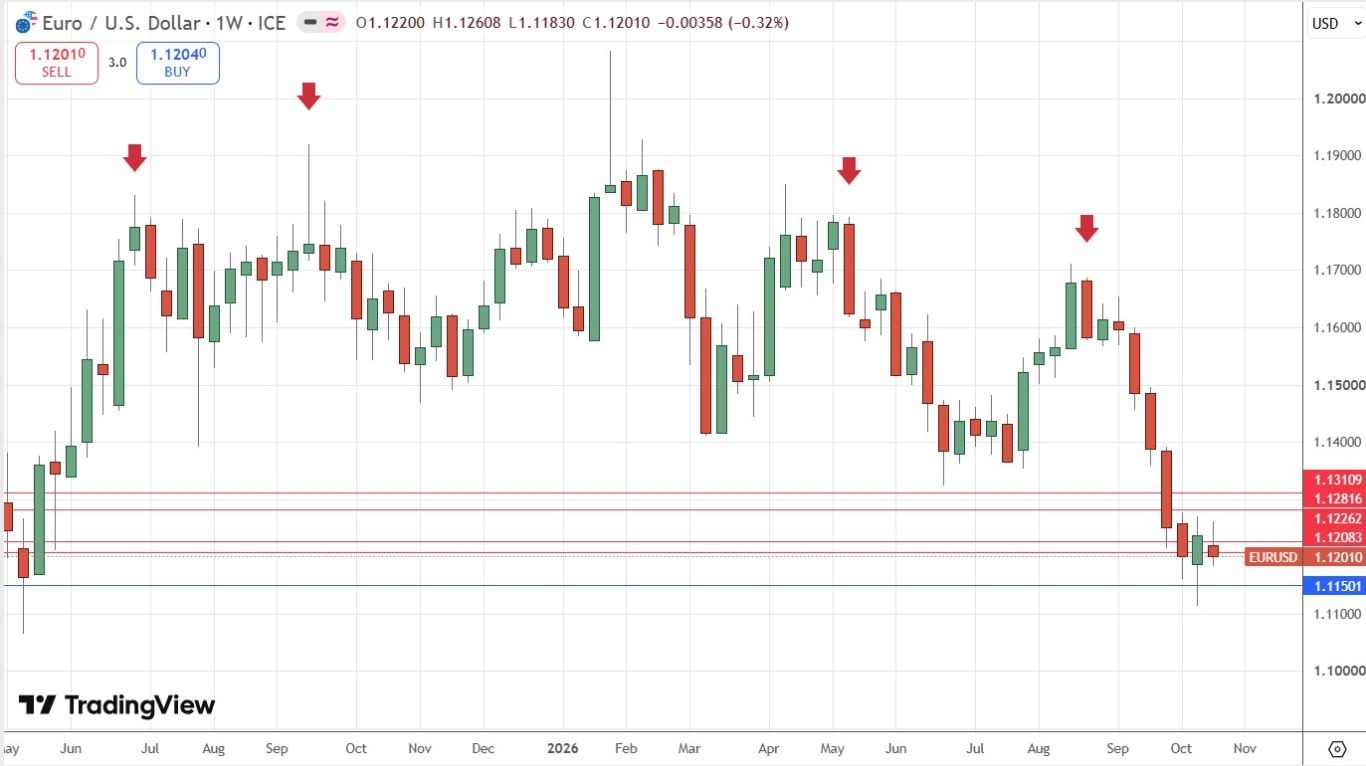
The EUR/USD currency pair fell last week, printing a bearish inside pin bar, and closing right on 1.1200. Given the strength and momentum of the long-term bearish trend, this likely signals a trend continuation, with a potential test of the recent 17-month low below 1.1150.
The technical picture is clearly bearish but the fundamental picture is less so, with the USD losing ground over the past two consecutive weeks. However, the Euro is looking weak, and was the only major currency except for the greenback to take a loss last week. There are fears over French and Eurozone debt, an energy crisis, conflict with Russia, and the riots and demonstrations centred on France but spreading to other Eurozone countries too are all taking their toll on the Euro.
There might be a lot of action and volatility in this currency pair over the coming week, with central bank meetings concerning both the EUR and the USD due.
I will remain in my short trade until we get a daily close above 1.1300. It is quite possible that the price will rise close this area and then turn bearish again, and if that happens, it could be an opportunity to enter a new short trade if that price action sets up. However, I think we are just going to see a fall below 1.1200 very early this week, and a test of the lows, so I am very comfortable being short here, especially as this currency pair has historically tended to trend very reliably.
EUR/USD Weekly Price Chart
WTI Crude Oil
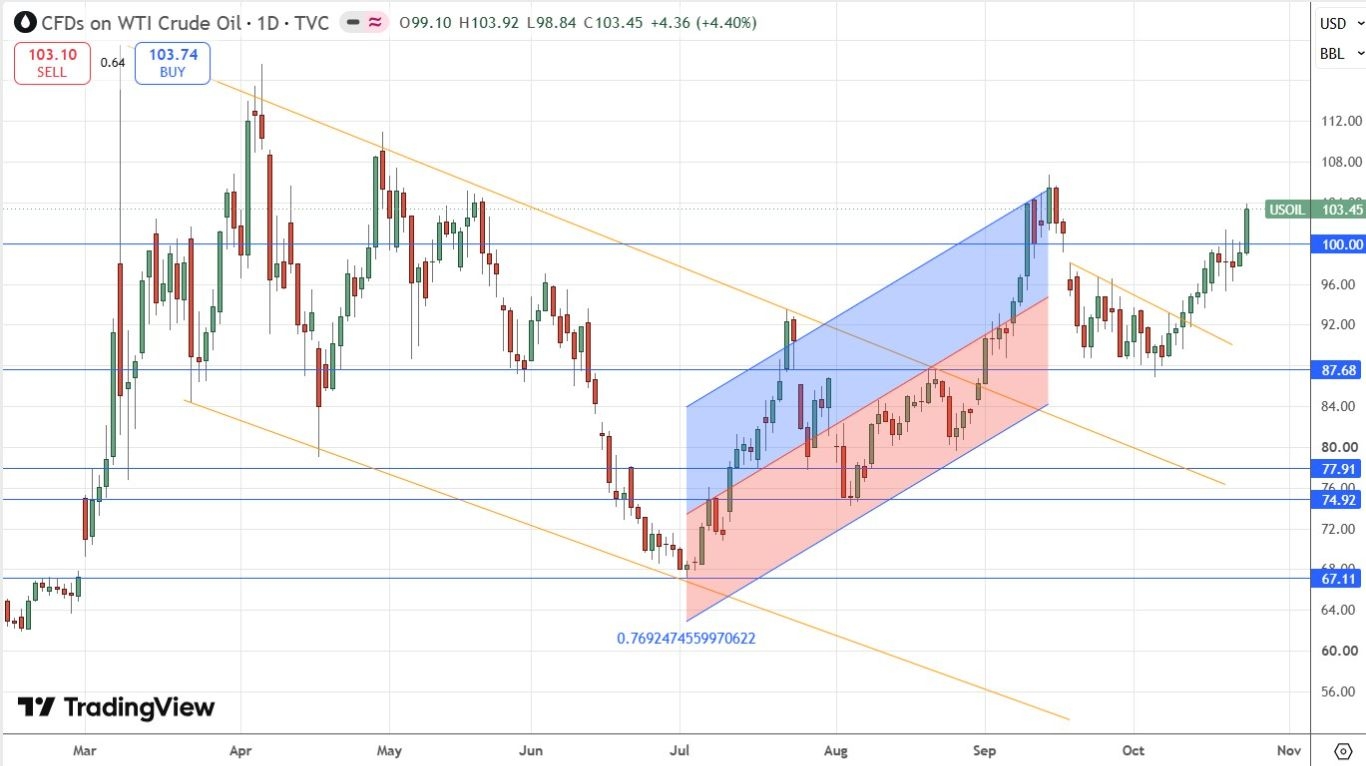
WTI Crude Oil has risen firmly again over the past week, breaking out above the resistance level and big round number at $100 as it continues to rise within the ascending price channel shown within the price chart below as a linear regression analysis.
As has been the case for many months, what happens militarily and geopolitically in the Strait of Hormuz and in the Gulf is the main driver here, making trading unpredictable. I thought it would be more predictable as it is obvious that President Trump will not launch serious attacks on Iran until after the mid-term US election is over on 4th November. However, there have been many rumours over the past week that the USA and/or Israel are preparing for a resumption of the kinetic war soon, and this has succeeded in driving the price of crude oil higher. It may be that the war talk is an election tactic by Israeli PM Netanyahu, who according to the polls is likely to be voted out of office this Tuesday.
Longer-term traders might do well to look for buying opportunities if they think a resumption of the war is going to happen after the mid-terms, but they might need to be quick to take profit, as President Trump tends to make moves pretty quickly to bring down the price of Crude Oil once it exceeds $100.
I will not trade WTI Crude Oil until after the mid-term election in the USA on 3rd November completes, at which time we will probably get to see what President Trump’s true intentions towards Iran are. If he wants to make more war, he may find that increasingly difficult if the Democrats take control of the Senate – prediction market Polymarket currently shows a 67% chance of the Democrats taking control of both the House and the Senate.
WTI Crude Oil Spot Daily Price Chart
Bitcoin
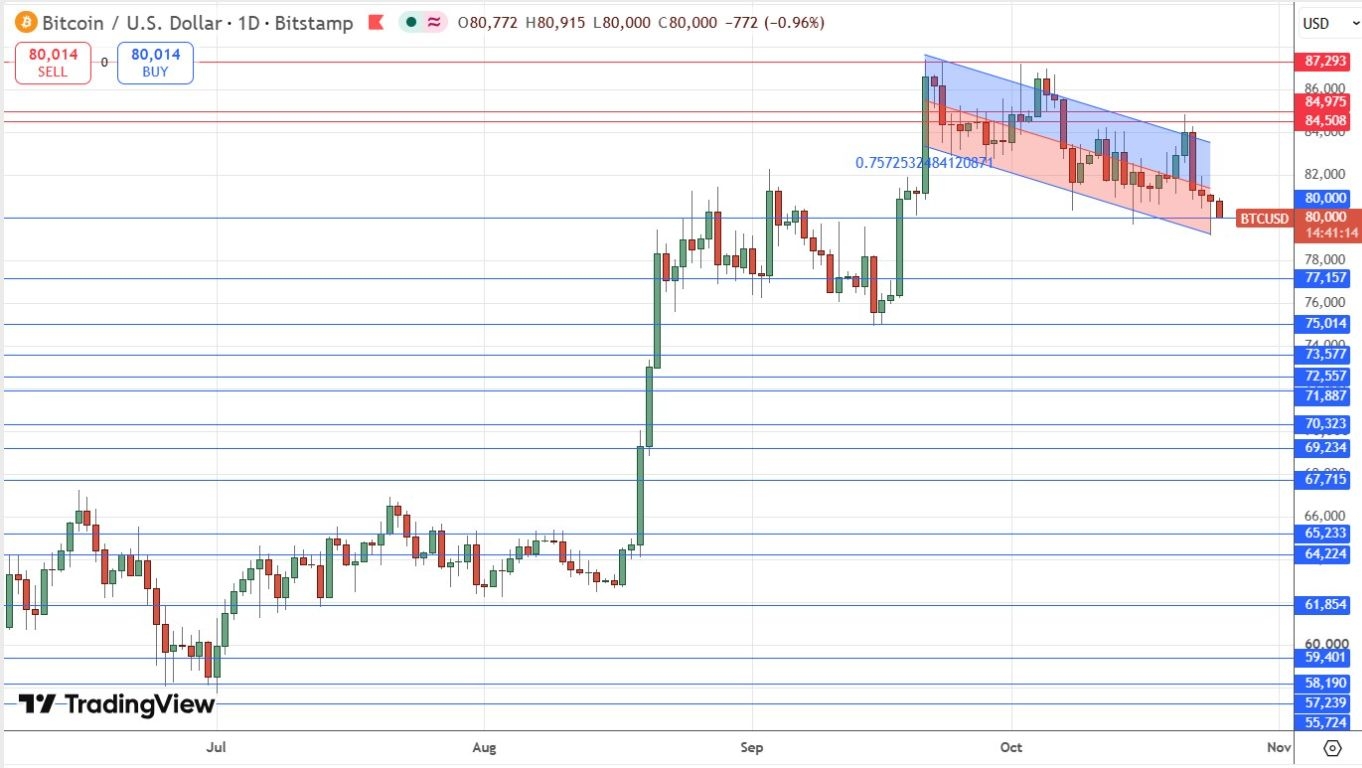
Until almost three weeks ago, Bitcoin was coiling tightly just below very key resistance at $87,293 and Ethereum was following a similar pattern. A bullish breakout to new multi-month highs and a move higher for the wider crypto asset classes was in view. However, after a few failed tests of the area, the price moved decisively lower, invalidating $82,000 as support, and threatening to break down below the big round number at $80,000.
The price chart below shows that the price action has been moving steadily lower in an orderly way, contained by a descending linear regression analysis / price channel, and is currently sitting right on the round number at $80,000 and looking heavy.
If we get a daily close below $80,000, I will see that as a decisive bearish sign and exit my long trade which I entered on the first major breakout a few weeks ago. This looks likely to happen, and might trigger a stronger fall to $77,157 or even lower.
A daily close above $87,293 and we could see the price move strongly higher quite quickly, although that is practically guaranteed not to happen any time soon. If by some miracle $80,000 survives, bulls will retain some hope.
I make purely technical calls on Bitcoin – I think outside of Africa it has no practical use whatsoever. Fortunately, Bitcoin tends to respect technical factors very well.
Bitcoin Daily Price Chart
Bottom Line
I see the best trades this week as:
- Short of the EUR/USD currency pair below 1.1300.
- Long of Bitcoin following a daily close above $87,293.
Ready to trade our weekly Forex forecast? Check out our list of the top Forex brokers.