


Top Regulated Brokers
The crypto market has spent the week retreating broadly, and the losses have not fallen evenly across the field. Bitcoin (BTC) is down but has absorbed less pressure than most assets around it. Ethereum (ETH) has given up more ground than Bitcoin, trailing by a meaningful margin. Uniswap has fallen harder still.
Against that backdrop, NEAR has moved in the opposite direction entirely, posting a sharp gain while the rest of the established liquid field moves lower. That divergence is visible and measurable, but what it means for the sessions ahead is less clear, and nothing in the available data points to a single cause.
Crypto Breadth Weakens as Losses Spread Across Sectors
Total crypto market capitalization is near $2.804 trillion, a decline from last weekends print. A reconstructed rolling seven-day cap-weighted view of the market puts the broader decline near -2.98%, capturing the cumulative pressure most large assets have absorbed since the prior weekly open.
That weekly weakness is clearest in breadth. Of the top 100 assets by capitalization, 29 are positive and 71 are negative on the week. Filtering to a cleaner screen of established liquid assets in the top 50 sharpens the picture further: 5 positive and 35 negative across 40 names, with a median loss of -6.49% and a cap-weighted result of -3.38%. The cap-weighted figure landing above the median reflects the relatively smaller losses among the larger assets. The majority of established assets remain deep in the red.
Bitcoin dominance sits at 59.45%, while Ethereum dominance holds near 10.92%. Reported 24-hour volume came in near $43.05 billion, down roughly 38.76% from the prior session. That drop confirms quieter participation without establishing cause or intent.
This quieter participation picture also includes a modest contraction in stablecoin supply. DeFiLlama's USD-pegged series moved from approximately $311.974 billion on October 4 to $310.979 billion on October 10, a decline of roughly $995 million or 0.32%.
Every fixed sector basket remained negative on the week: large layer-one protocols -5.60%, privacy assets -6.29%, established meme assets -6.35%, DeFi/oracle assets -7.92%, and payments/value transfer names -8.87%.
Four Assets Show a Market Moving in Different Directions
Bitcoin Limits Its Decline but Trades Below Near-Term Resistance
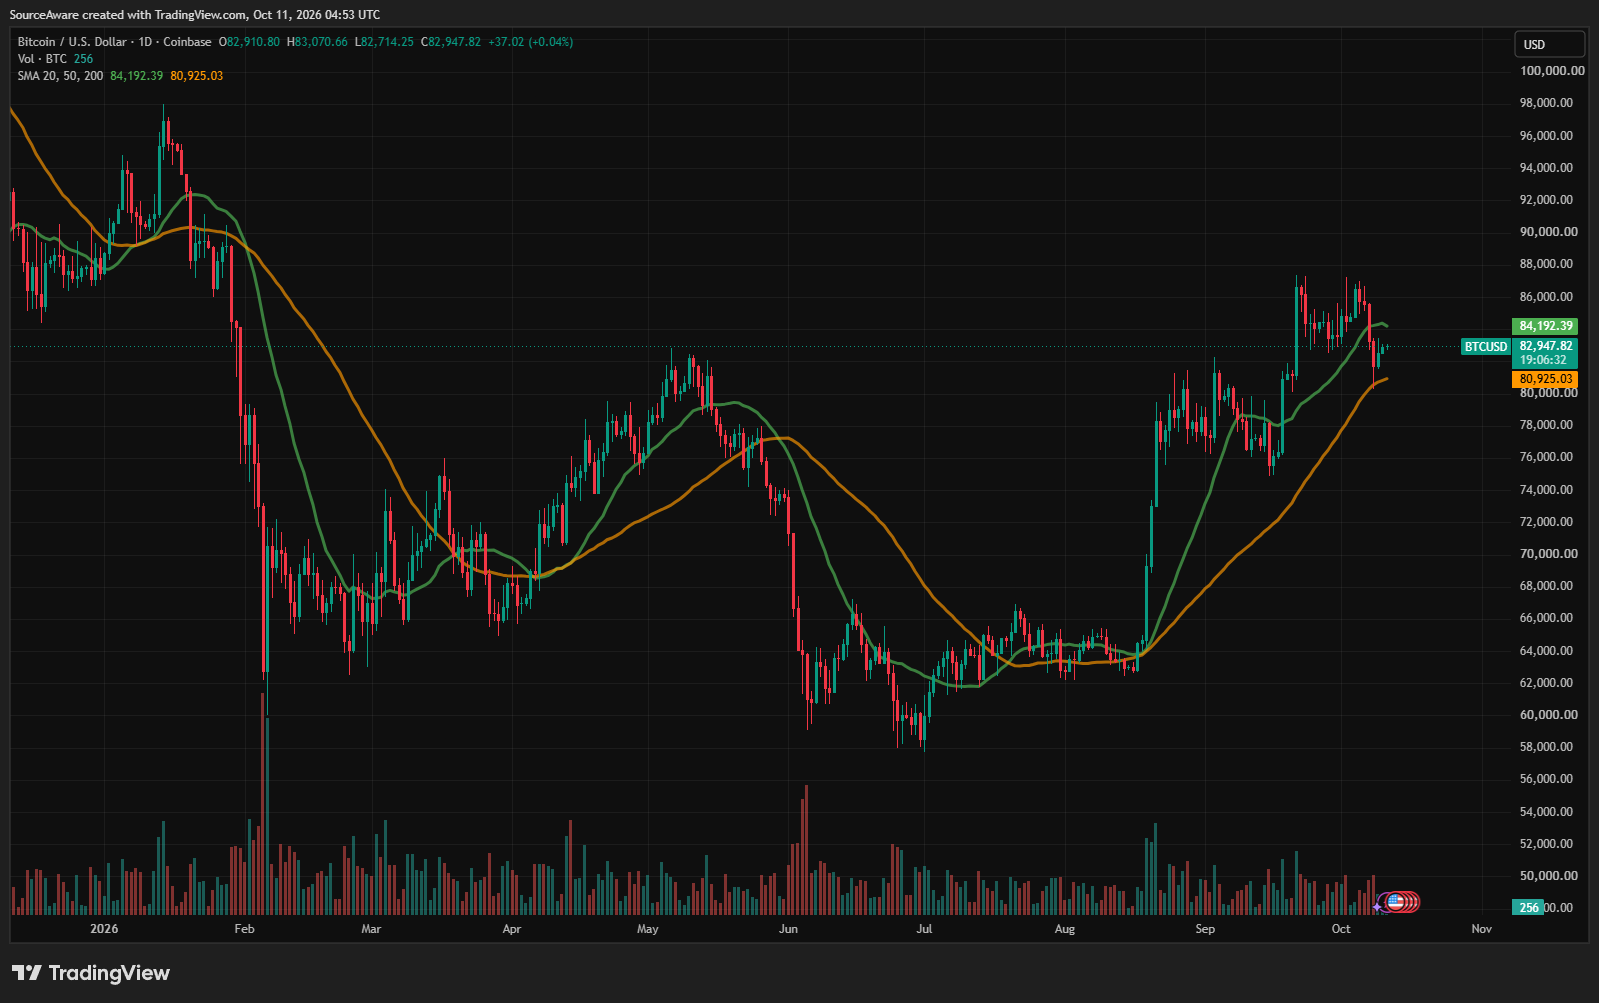
Data provided by TradingView, cross-referenced against Coinbase and CoinMarketCap, shows Bitcoin trading near $82,947 at the time of writing, with a TradingView weekly decline of roughly 2.16% and a rolling seven-day CMC loss of roughly 2.19%.
BTC/USD 1-day chart. Source: TradingView
The seven completed Coinbase candles span approximately $80,315 to $86,996, a spread of about $6,681. Bitcoin sits below its 20-day simple moving average near $84,192 and above its 50-day simple moving average near $80,925. A confirmed move back through the 20-day would test whether this week's decline has stabilized; a break below the 50-day would push price into a zone where neither average provides near-term reference.
Bitcoin's rolling seven-day CMC loss of roughly 2.19% compares with the -6.49% clean-screen median and Ethereum's -6.74%. That gap accounts for the relative resilience visible in the weekly data while leaving Bitcoin clearly negative for the week.
NEAR’s Sharp Gain Stands Apart From the Wider Market
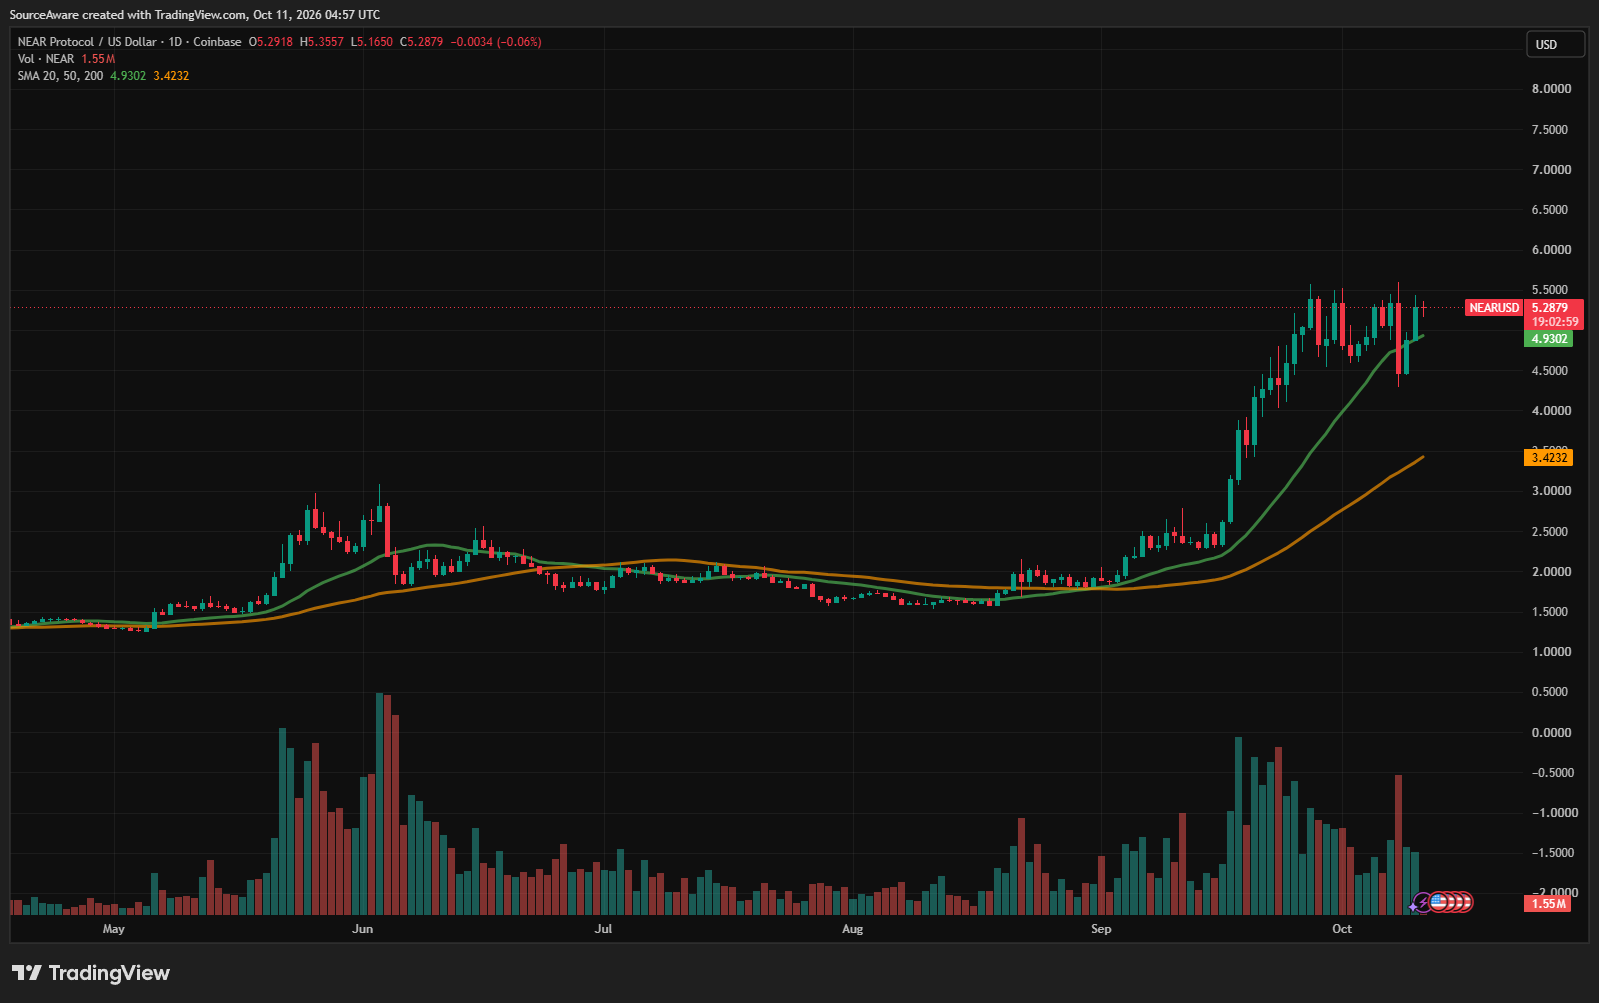
NEAR trades near $5.2879, with a weekly gain of roughly 9.29% on TradingView and a rolling seven-day CMC gain of approximately 9.83%, including a 24-hour advance of roughly 7.70%.
NEAR/USD 1-day chart. Source: TradingView
The seven completed Coinbase candles span approximately $4.2952 to $5.5935, and current price sits in the upper portion of that range. NEAR trades above its 20-day simple moving average near $4.9302 and well above its 50-day simple moving average near $3.4232.
That makes NEAR the clearest positive divergence in the cleaned liquid screen this week. There are no immediately clear catalysts for the move, and the gap between NEAR's gain and the field's median loss is measured and sharp. Whether that gap persists or narrows depends on factors not visible in the available data.
Ethereum’s Deeper Loss Leaves It Below Key Averages
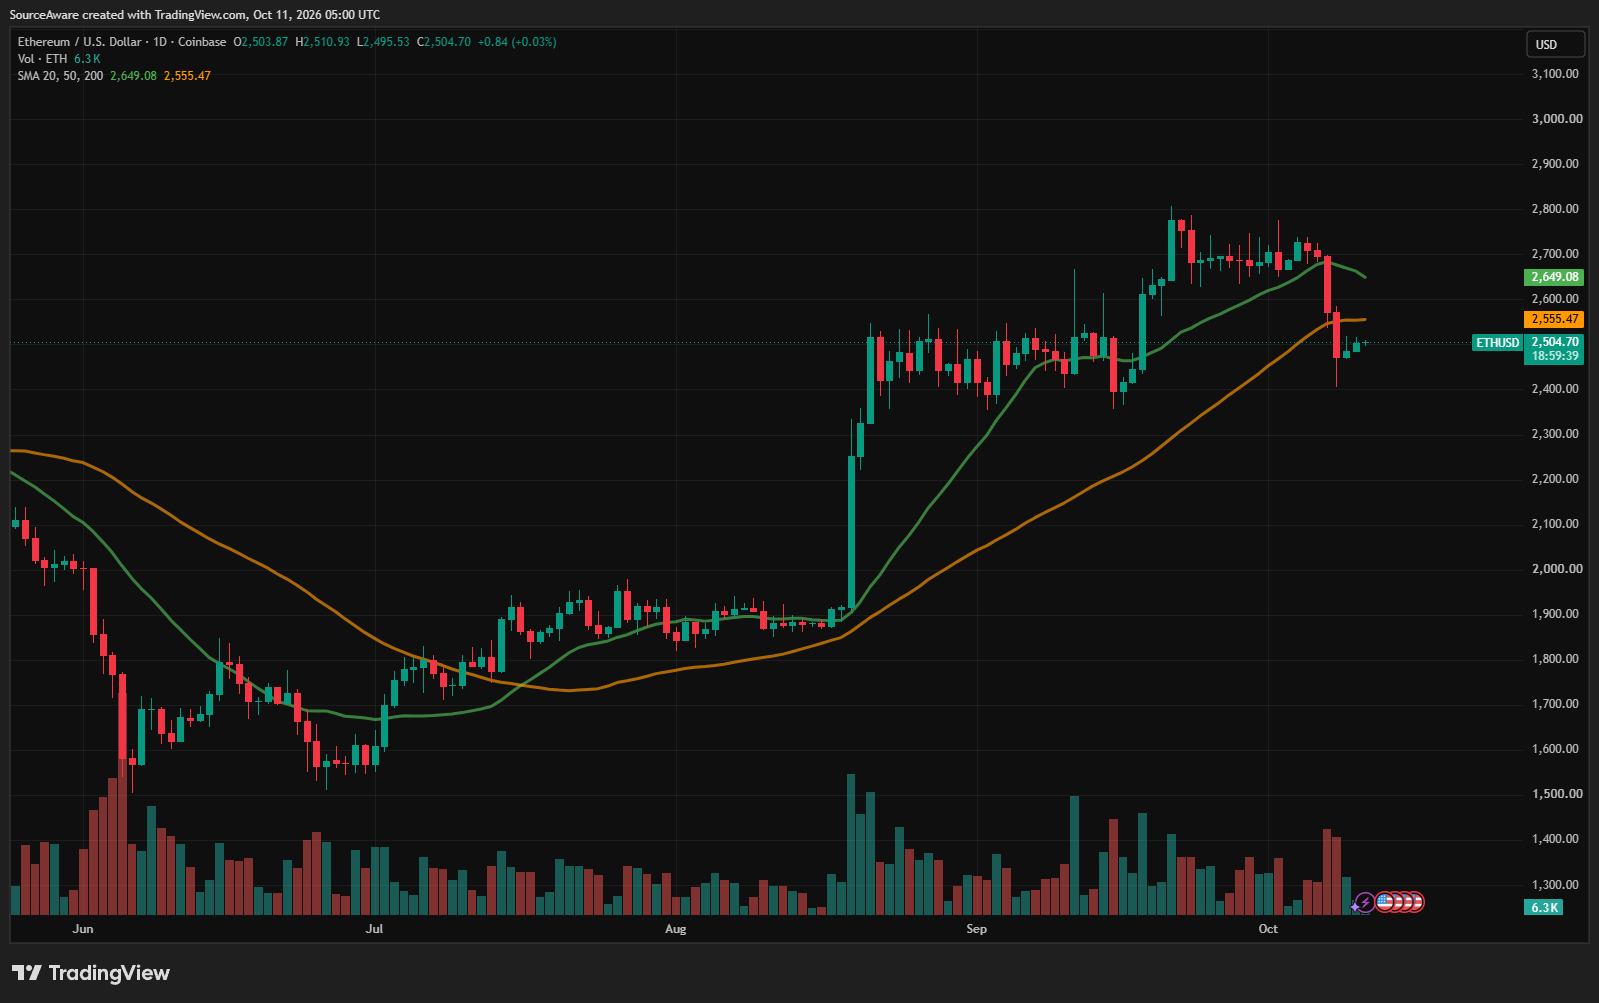
By contrast, Ethereum trades near $2,505, down approximately 6.74% on CMC's rolling seven-day view and 6.78% on TradingView's weekly field. The seven completed Coinbase candles span roughly $2,405 to $2,739.
ETH/USD 1-day chart. Source: TradingView
Both the 20-day simple moving average near $2,649 and the 50-day simple moving average near $2,555 sit above current price. A confirmed move back toward the 50-day would represent the nearer test; reclaiming the 20-day would require a larger recovery from the current level.
Ethereum's loss exceeds Bitcoin's by roughly 4.5 percentage points this week, consistent with its weaker price performance. It is the weaker major in a week where most assets have fallen.
Uniswap Tests Support After the Week’s Sharpest Decline
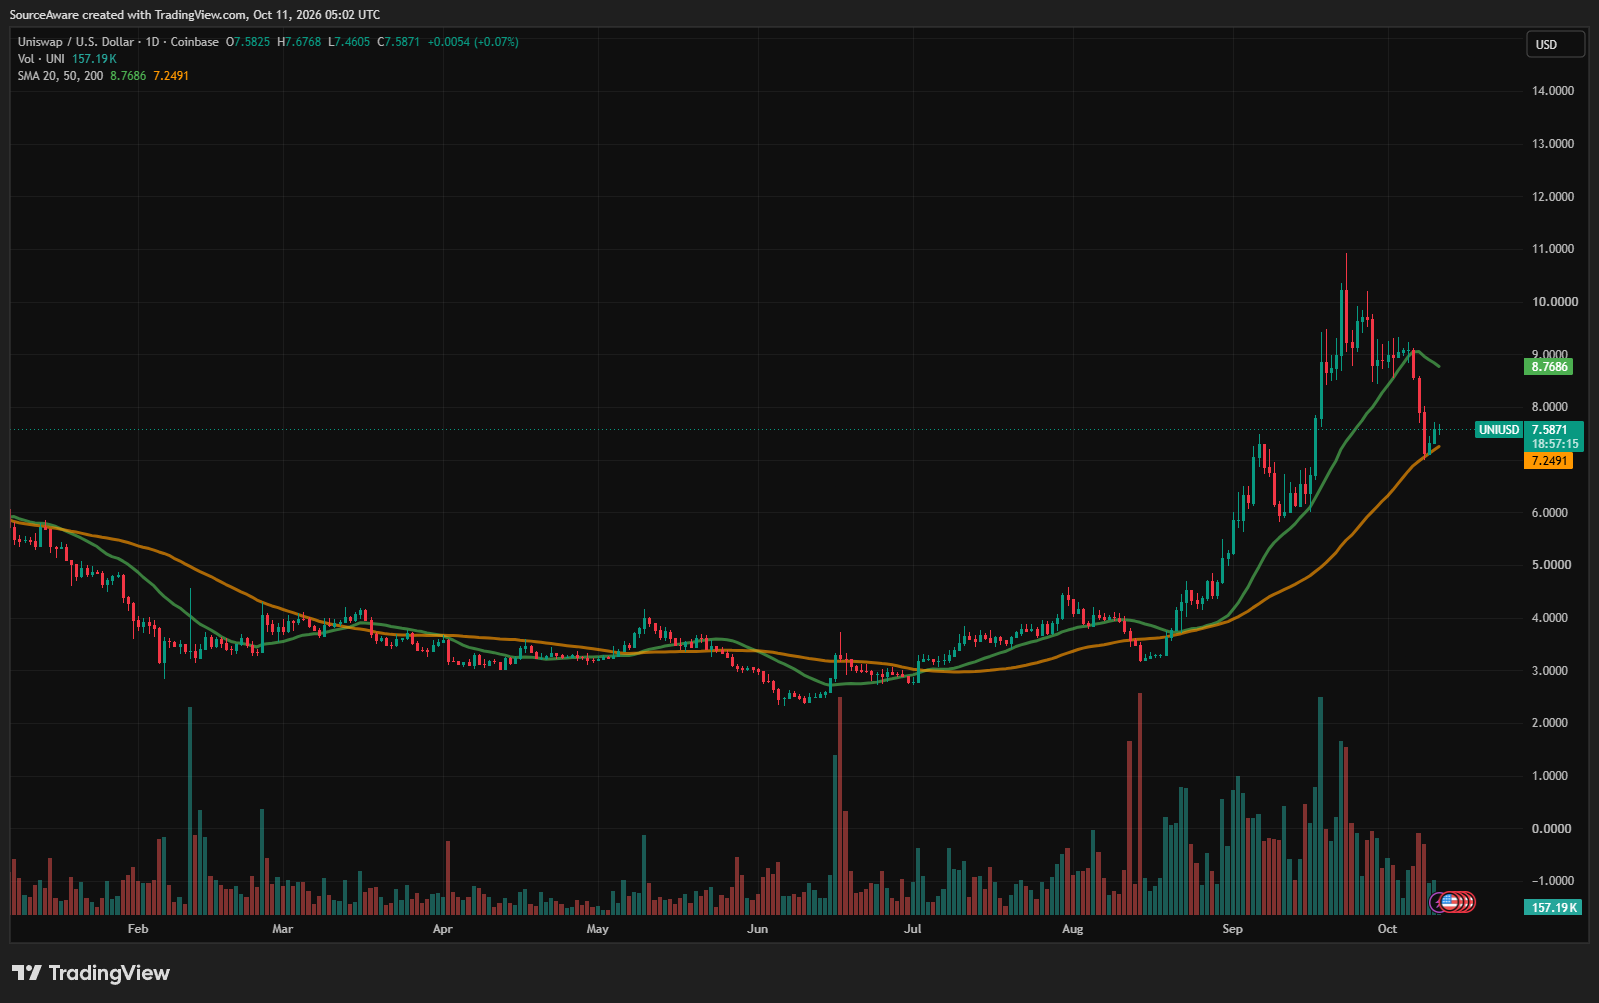
Uniswap trades near $7.5871, with a weekly loss of roughly 16.08% on TradingView and a rolling seven-day CMC reading of approximately -15.90%. The seven completed Coinbase candles span approximately $6.9930 to $9.2396, and price is currently trading in the lower portion of that range.
UNI/USD 1-day chart. Source: TradingView
UNI sits well below its 20-day simple moving average near $8.7686 and close to its 50-day simple moving average near $7.2491.
UNI is the deepest established loss in the cleaned liquid screen this week, but not completely unexpected. Over the span of 40 days, from Aug. 14 to Sept. 23, its price increased 242%, and it is now in a corrective phase and testing out support at $7.25. Its proximity to the 50-day sets a legible test: sustained trade above that level would contain damage to a shorter window, while a confirmed break below it would extend the loss into a longer timeframe.
Why a One-Day Market-Cap Rise Does Not Yet Repair Breadth
Breadth figures are snapshots rather than a complete advance-decline index. The 5/35 clean-screen split remains stark, and accumulated weekly losses still outweigh the 24-hour improvement in total capitalization. Changes in the largest assets can shift aggregate capitalization faster than the median moves, which is why a modest one-day gain coexists with broadly negative weekly breadth. Weekly breadth remains too negative to call the improvement a broad repair.
Stablecoin supply fell roughly $995 million over the measured window. The DeFiLlama series is revisable and an imprecise liquidity proxy, so it cannot show where capital moved or how it was deployed. Reported volume falling roughly 38.76% from the prior session confirms quieter conditions without establishing intent.
The four pairs shown here illustrate the range of outcomes seen across the market. Bitcoin, NEAR, Ethereum, and Uniswap span from a sharp positive outlier to the week's deepest established decline. Aside from the macro factors affecting all financial markets right now, there is no other identified common cause across those four moves, or that explains NEAR's advance specifically.
The Next Test Is Whether Participation Broadens Beyond Bitcoin
A week of broad losses can begin to repair, before aggregate capitalization confirms a clear direction. A further rise in the top 100 positive count, a less-negative cleaned-screen median, and continued softening in Bitcoin dominance would suggest participation spreading more widely. In that environment, the gap between NEAR's gain and the field's losses would narrow as more assets find footing, while Ethereum and Uniswap could recover part of their weekly declines without fully erasing them.
Yet the opposite path keeps volume subdued, breadth deeply negative, and Bitcoin carrying a disproportionate share of any aggregate gain. That combination would leave overall capitalization appearing steadier than the typical established asset's position justifies, and would deepen, the divergence the current data already shows.
The sessions ahead will show whether the market's one-day improvement extends into the breadth and the median or fades back toward concentration in the largest asset. Bitcoin's position relative to its moving averages, Ethereum's distance below both, and Uniswap's proximity to its 50-day offer measurable reference points going forward. NEAR has the widest positive gap from the cleaned screen median, but its persistence without an identified driver remains difficult to place in a broader context.
Ready to trade our overview of the crypto market? Here’s our list of the best MT4 crypto brokers worth checking out.