


Bearish view
Top Regulated Brokers
Sell the AUD/USD pair and set a take-profit at 0.6835.
Add a stop-loss at 0.7050.
Timeline: 1-2 days.
Bullish view
Buy the AUD/USD pair and set a take-profit at 0.7050.
Add a stop-loss at 0.6835.
The AUD/USD pair continued its strong sell-off, reaching its lowest level since June 30th, and is down by nearly 4% from its highest point in September. It dropped to 0.6947 as traders focused on the upcoming US nonfarm payrolls report.
US NFP and PMI Report
The AUD/USD pair continued its strong downward trend as the US Dollar Index (DXY) jumped to 101.47, its highest level since July 28. The dollar jumped after some mixed macro data, with a report showing that the private payrolls rising by 90k, higher than the expected 73k.
Another report by the Bureau of Economic Analysis (BEA) showed that the core PCE rose from 0.1% in July to 0.2%, missing the estimated 0.3%. This inflation rose 3.0% on an annual basis. The headline PCE rose 3.4% on an annual basis.
The next important numbers to watch will be the initial and continuing jobless claims report. These numbers will come a day before the US publishes the latest nonfarm payrolls report, which will provide more color on the state of the labor market.
The US will also release the ISM manufacturing PMI report. These numbers come at a time when US bond yields are in a strong uptrend, with the ten-year yield hitting 5.28% and the 30-year rising to 5.63%.
The AUD/USD pair is also reacting to the recent events from Australia. The Reserve Bank of Australia (RBA) decided to hike interest rates by 0.25% on Tuesday. It was the fourth rate hike of the year, with officials hinting that they will hike rates again.
Another report showed that the monthly CPI rose from 3.50% in July to 4% in August, lower than the estimated 4.10%. The weighted and trimmed mean rose 3.6% last month.
AUD/USD Technical Analysis
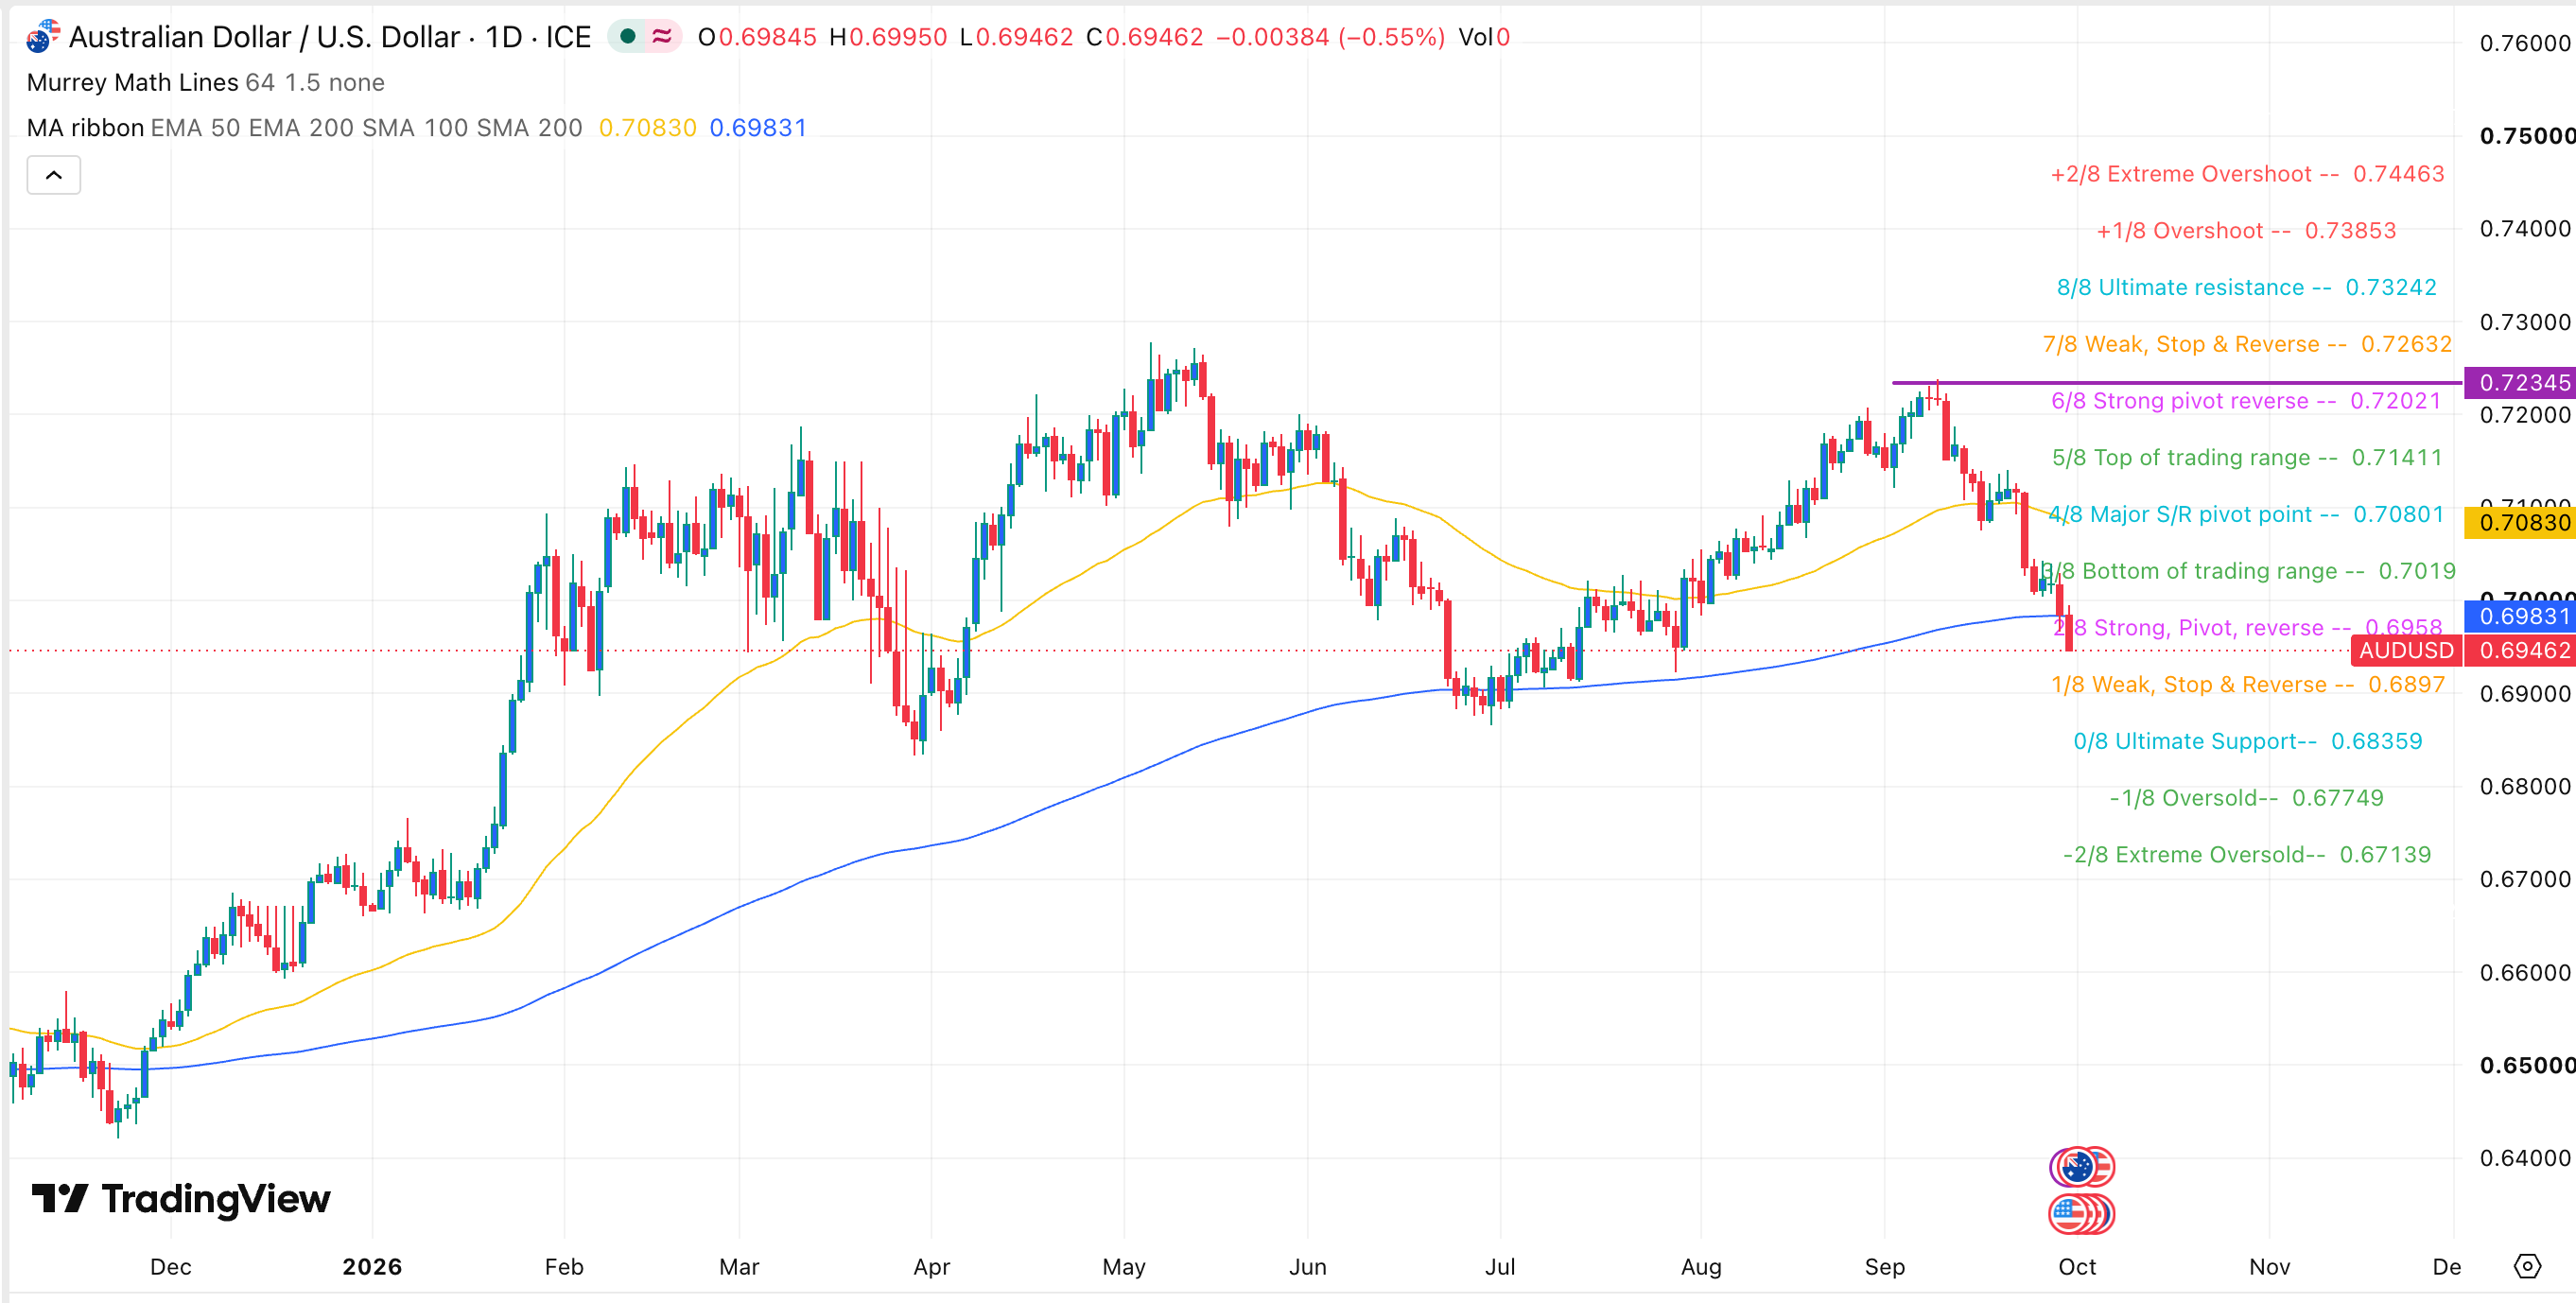
The daily chart reveals that the AUD/USD pair has slumped in the past few weeks, moving from a high of 0.7234 to the current 0.6948. It has dropped below the Strong, Pivot, and Reverse level of the Murrey Math Lines tool.
The pair has fallen below both its 50-day and 200-day Exponential Moving Averages (EMA), and the Relative Strength Index (RSI) has continued to decline this week. Together, these signals point to sustained downside momentum, with a potential move toward key support at 0.6835.