


Fundamental Backdrop and Market Sentiment
I wrote on 30th August that the best trades for the week would be:
Top Regulated Brokers
Long of Sugar. Sugar futures rose by 2.09% over the week.
Long of Wheat. Wheat futures fell by 6.38% over the week.
Long of Soybeans. Soybean futures rose by 1.63% over the week.
Long of Ethereum following a daily close above $2,515. This did not set up yet.
The total loss of 3.72% averages to 1.24% per asset.
A summary of last week’s most important data in the market:
Top Regulated Brokers
US Average Hourly Earnings – month on month growth of 0.3% just as expected.
US Non-Farm Employment Change – this was much stronger than expected, with 162k net new jobs created while only 55k were expected.
Bank of Canada Policy Meeting – held rates as expected.
US ISM Manufacturing PMI data – just a touch worse than expected.
Reserve Bank of New Zealand Policy Meeting – the rate hike of 0.25% was expected and priced in, but what did have an impact was the dovish forward guidance away from a potential further rate hike in October.
Australia GDP – this came in a fraction higher than expected, showing a nominal GDP of 0.8%.
USA Unemployment Rate – as expected.
Canada Unemployment – as expected.
The currencies which were most affected by these items last week were the US and New Zealand Dollars, with the greenback getting a minor boost on Friday while the Kiwi faced a headwind from its central bank. Yet the biggest market event last week was unscheduled, yet it managed to move most Japanese Yen pairs and crosses by more than 2% from the weekly open to the weekly close. This was the rumoured intervention in favour of the Japanese Yen by a coordinated force of the US Treasury and the Bank of Japan. It should be noted that this has not been formally confirmed. Many analysts argued there was no intervention, just a growing realization in the market that the yield differential is going to evaporate and hawkish comments on the Bank of Japan from both a member and from the US Treasury. In any case, it was the big move in favour of the JPY which dominated markets, both in Forex and generally.
Another major event last week was the escalation between the USA and Iran, which has driven the price of Crude Oil higher after it broke out from its postwar descending price channel.
The Week Ahead: Key Data and Events to Watch
Next week will see several highly important data items. The coming week’s most important data points, in order of likely importance, are:
US CPI (inflation)
US Purchasing Power Index (inflation-related)
ECB Policy Meeting (Eurozone central bank)
UK GDP
Monday is a public holiday in the USA and Canada.
Monthly Forex Forecast: September 2026 Overview
For the month of September, I made no forecast, as the US Dollar has no real long-term trend.
Weekly Forecast 6th September 2026
This week, I forecast that the following currency crosses are likely to rise in value:
CHF/JPY
EUR/JPY
GBP/JPY
NZD/JPY
Volatility was higher last week, with 26% of the notable currency pairs and crosses moving by more than 1% in value. Next week’s volatility is likely to be similar or even a little higher.
You can trade these forecasts in a real or demo Forex brokerage account.
Technical Overview and Key Levels
Key Support and Resistance on Major FX Pairs
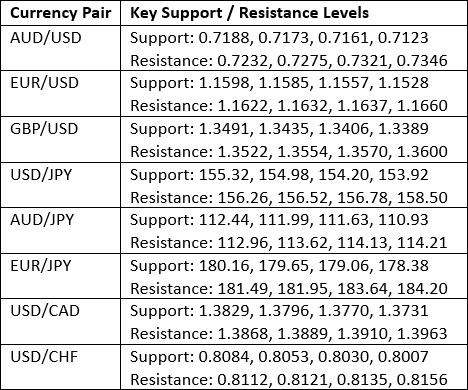
Key Support and Resistance Levels
US Dollar Index
The US Dollar printed a relatively large and full bearish candlestick last week, and although it has a meaningful lower wick, its close was not very far from the low of the weekly range. We see the weekly close below its levels from both three and six months ago, meaning by my preferred definition there is a long-term bearish trend, but I put no store in this indicator when price action is congested, not to mention the succession of higher lows and higher highs which we have seen here since mid-March.
I think that it makes sense to see the hawkish pressures that are being put on the US Dollar while also understanding that does not necessarily mean the price is going to go significantly higher.
I am most comfortable ignoring the US Dollar right now, and taking trades based upon what is going on with other assets. If their cases are convincing, I am indifferent towards the USD’s role in the trade.
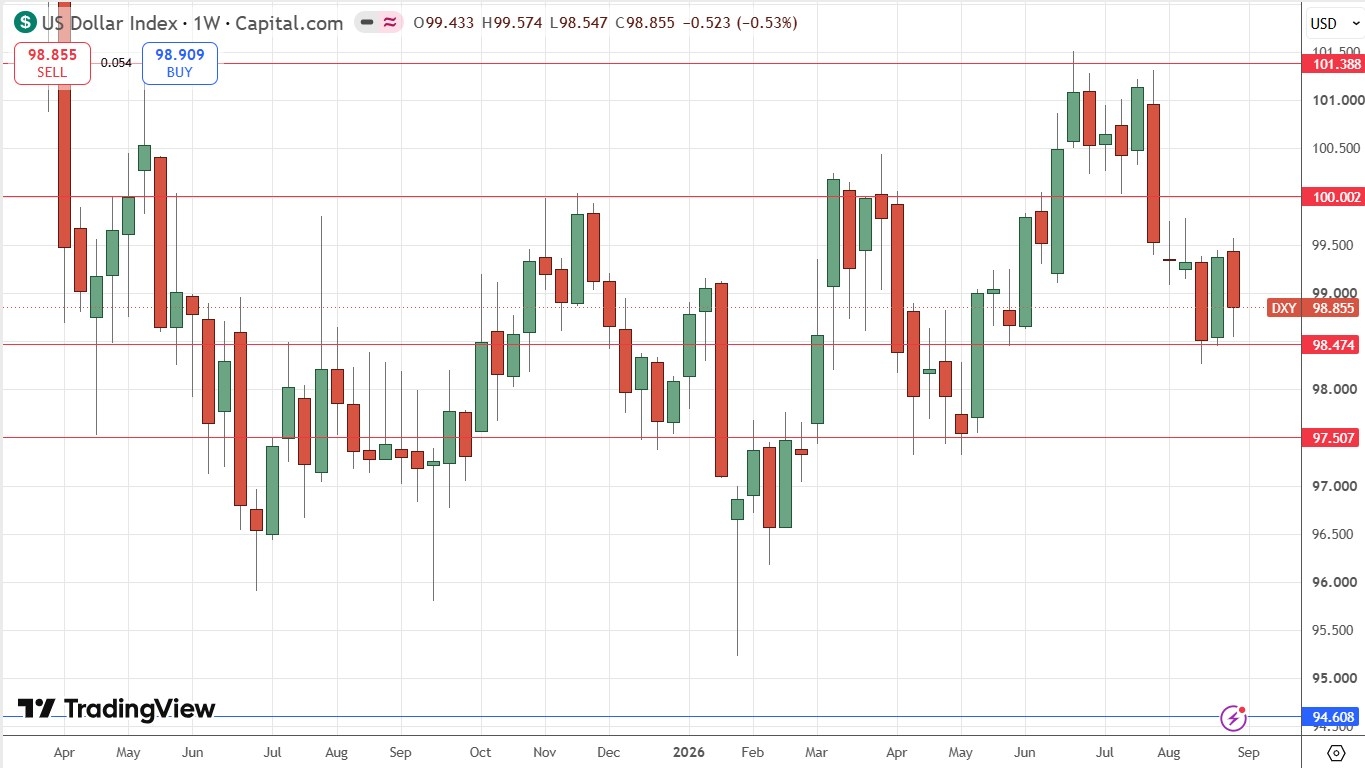
US Dollar Index Weekly Price Chart
USD/JPY
There was a strong bearish move in the USD/JPY currency pair last week. Note what a perfect move this was technically – the high of the week rejected the broken trend line from below which had been supporting the year-long bullish trend. The price then took a huge fall over the week before finding support just above 155 at 155.32 and potentially forming a double bottom. The candlestick is very large but there is a bit of a lower wick to it.
Typically, when the Japanese Yen makes such a large move within one week, it tends to bounce back to the next week. I think this is likely to happen, even through it is not clear that this sharp appreciation by the Yen was driven by a central bank intervention to prop up the Yen. It may have been a natural market move driven by a growing realization that the yield differentiation here will dry up as the Bank of Japan takes more hawkish actions over the coming months.
I expect that the price will bounce back over the coming week, but you may be wiser to play that long of some of the Yen crosses and not here against the US Dollar.
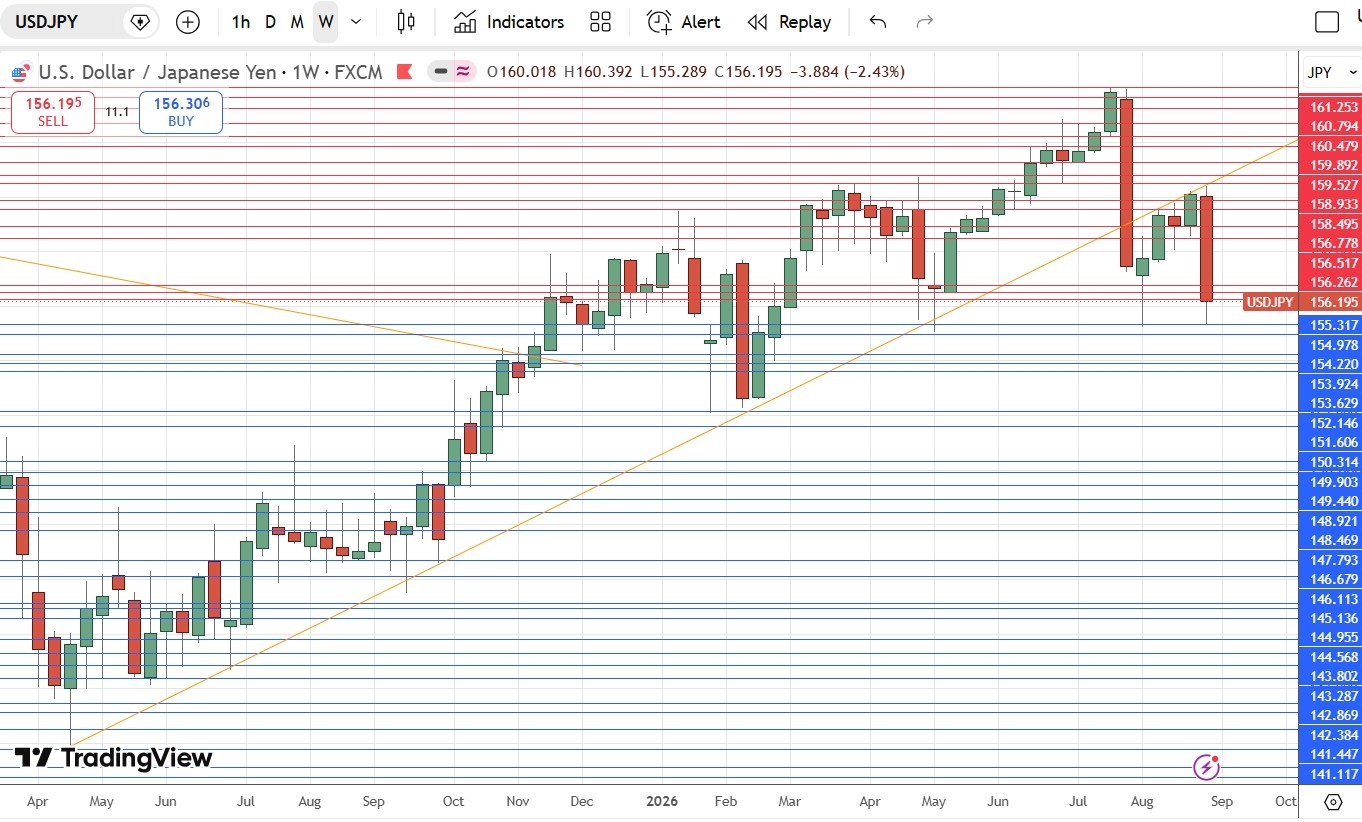
USD/JPY Weekly Price Chart
NZD/USD
Although the US Dollar lost some ground last week, the New Zealand Dollar was the weakest major currency, helped by the Reserve Bank of New Zealand’s obviously hawkish tilt as it hedged its bets over an October rate hike, making it look unlikely to happen. The Kiwi has been prone to sudden declines lately, so this is all part of the same market mood.
This might make the NZD/USD currency pair sound interesting to you on the short side, but just look at the weekly price chart below and how choppy and consolidative it looks. To be fair I’ve seen choppier price action. If you are going to trade the Kiwi, you are likely going to be better off shorting it against other currencies.
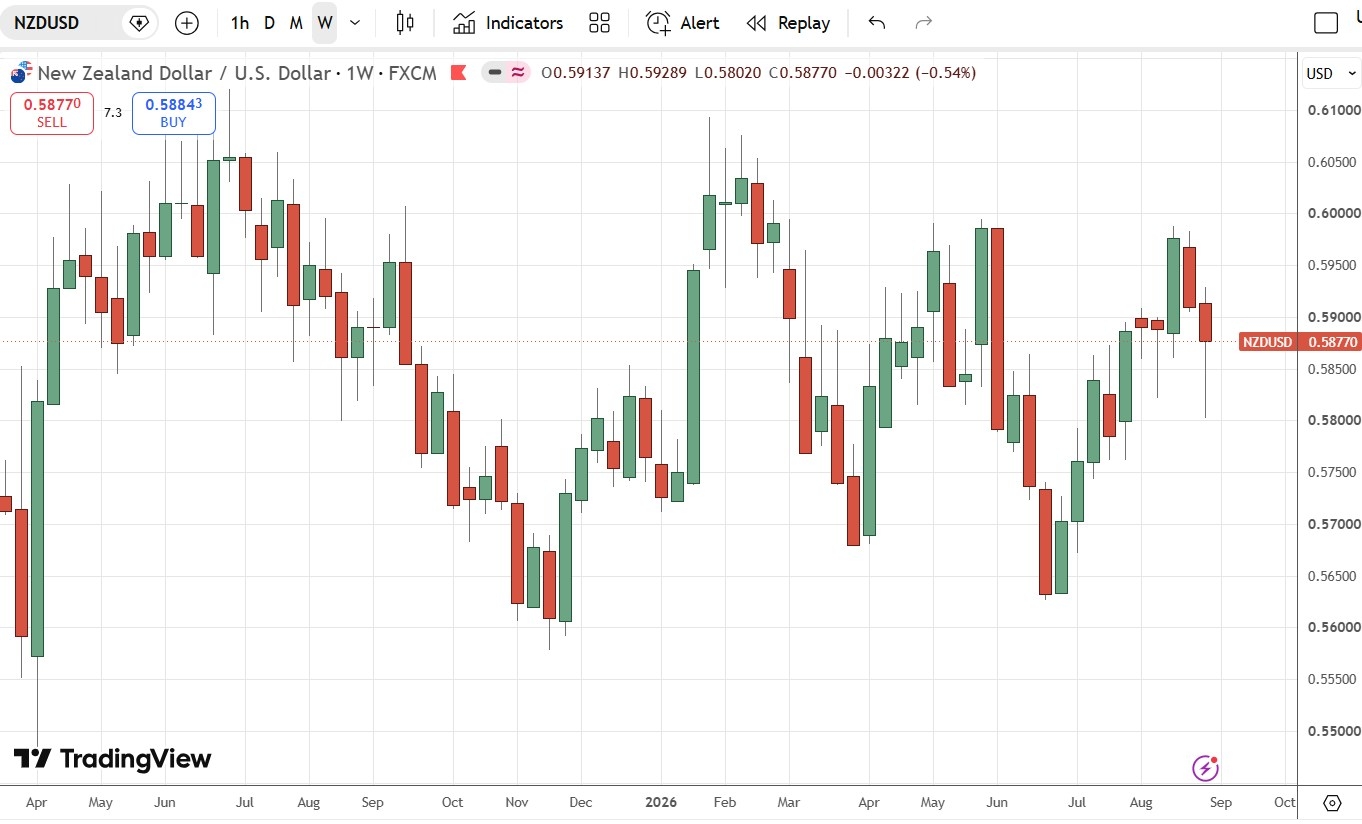
NZD/USD Weekly Price Chart
Sugar Futures
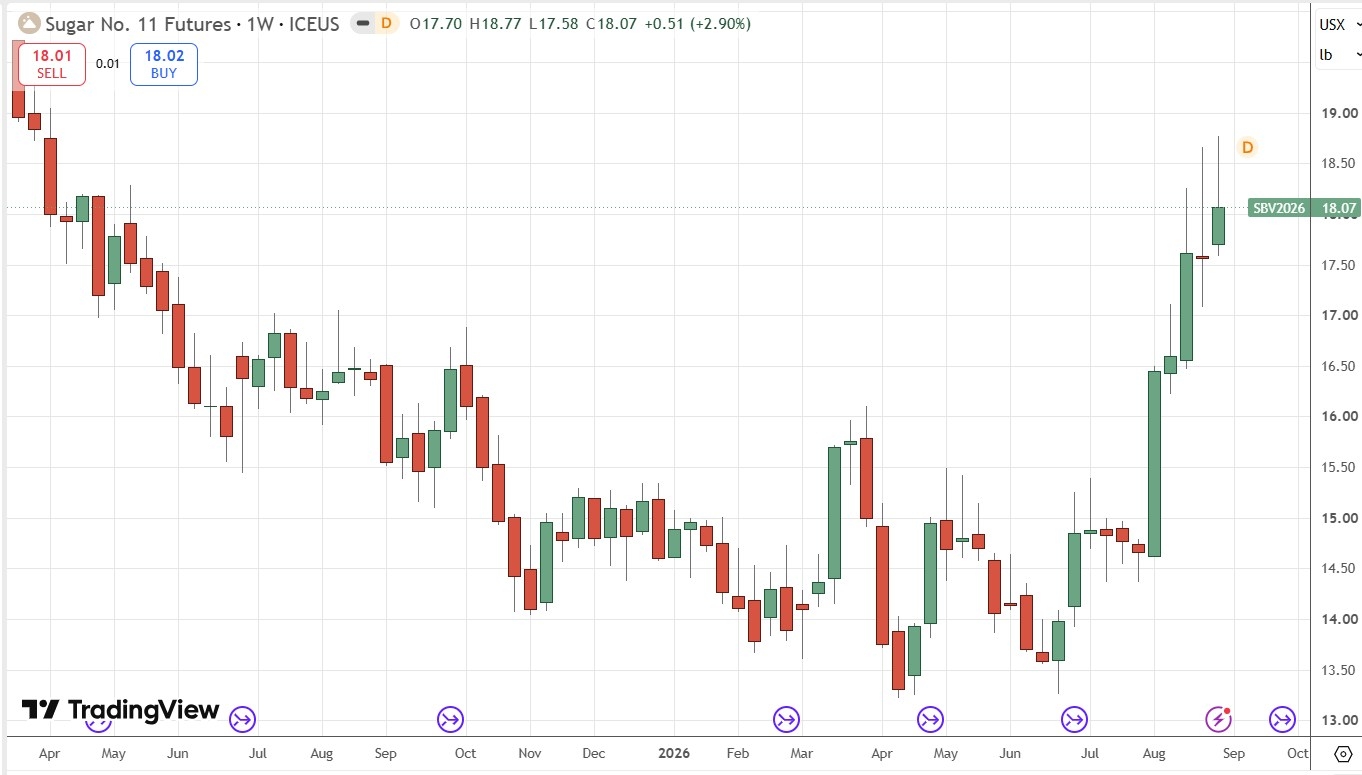
Sugar futures rose again last week to new long-term high prices, but the price chart below shows a significant upper wick in the last week’s candlestick, just like the previous two weeks, which show that this bullish move is struggling against sellers a bit.
Despite that, the price is advancing, pushed higher by problematic weather in Africa and South America where most sugar cane in grown. Demand for sugar remains as high as ever, with the growing awareness of the health dangers of refined sugar not clearly translating into a fall in demand.
This trade might still have legs, but if you are not already long here, it might be wise to either use a tighter stop, or wait for a new daily closing price which is also a 1-year high.
Sugar Futures Weekly Price Chart
Soybean Futures
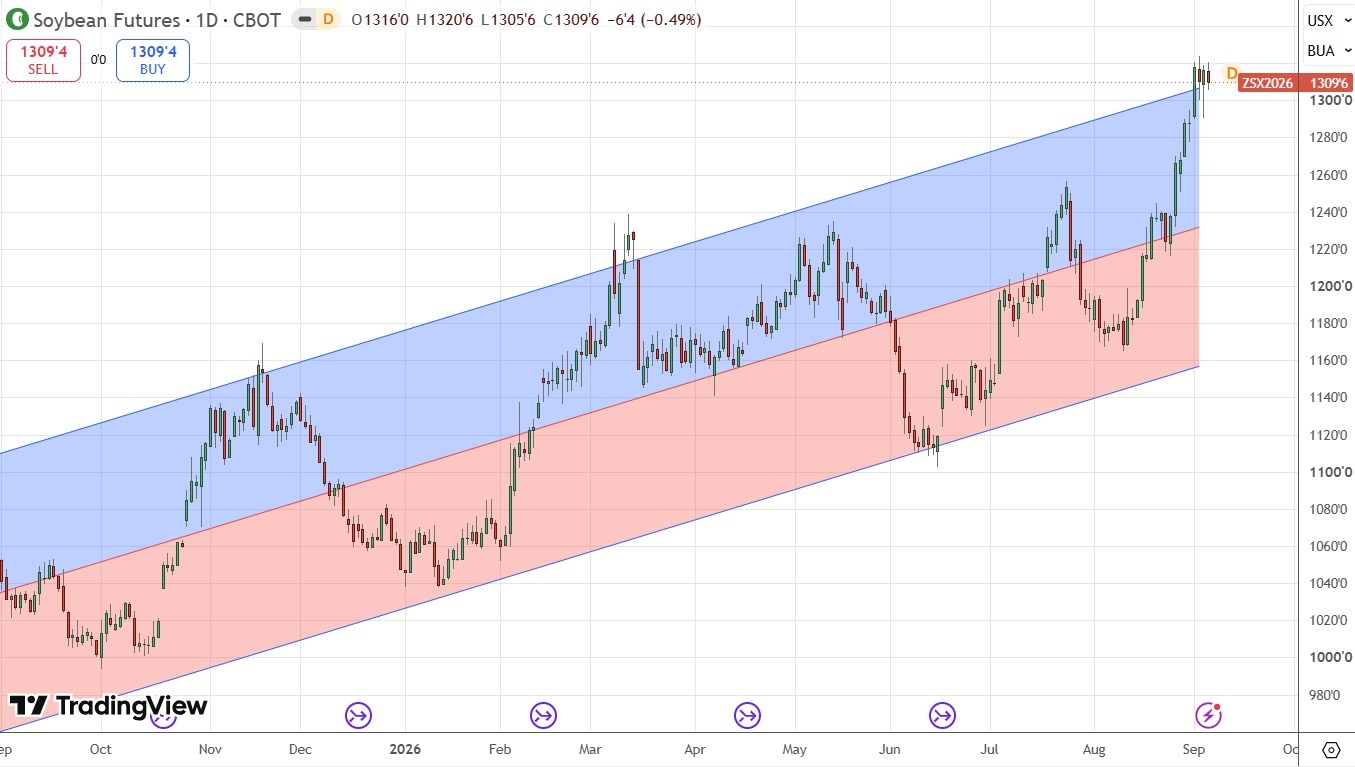
Soybean Futures made another strong bullish breakout last week, rising forcefully to end the week with a short consolidation just below the new 2.5-year high price. The price action looks very bullish and of all the agricultural commodities which have been breaking out lately, this one has done the best.
This looks like an exciting long trend trade where it is just a question of holding on until a consistent trailing stop (ideally based upon volatility) takes you out.
There are signs that this trend could be unusually reliable, as for several months the price action has been almost completely held by ascending price channel drawn via the linear regression anlaysis study visible in the price chart below. The latest breakout has sent the price above the top of the channel, which is another bullish sign.
If you have not entered this trade yet then it is worth considering, because being long of commodities at long-term bullish breakouts has historically been a very profitable trading strategy. It might be wise to control risk by entering with half the normal position size, as the move might be very over-extended.
The price of Soybeans has begun rising strongly as markets have started to price in Black Sea disruption due to the Russia/Ukraine war but even more importantly, stronger Chinese buying plus late-season crop risk.
If Soybean futures are too big for you, consider an alternative ETF like SOYB which is much more affordable.
Soybean Futures Daily Price Chart
WTI Crude Oil
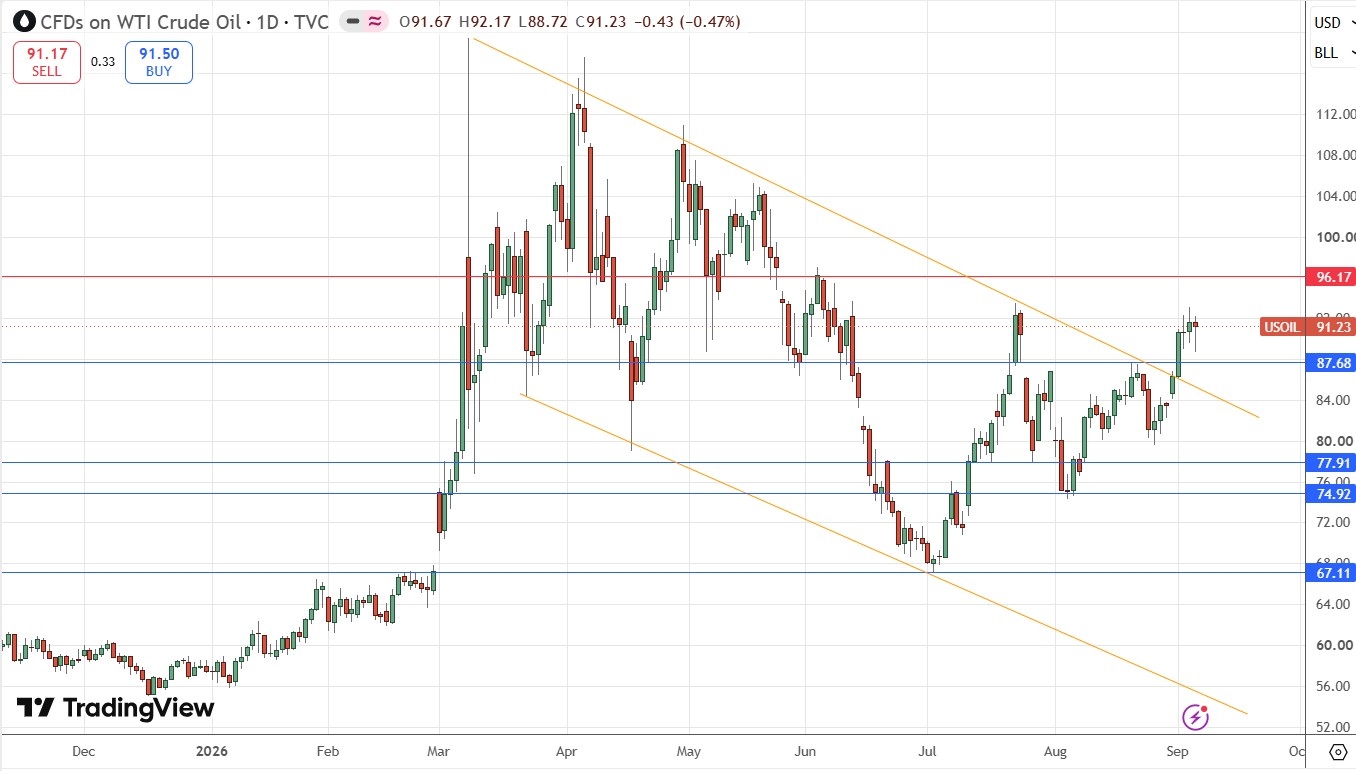
WTI Crude Oil is starting to show a very interesting technical feature in its daily chart below – a bullish breakout above the descending price channel which also looks like a bullish flag! The descending channel has held since the end of the Iran/USA/Israel war last spring.
Many analysts last week were touting the US’s ability to remove the Strait of Hormuz as a chokepoint, by opening channels for the export of crude oil from the Gulf. However, the military escalation between the USA and Iran which has emerged over the past week has been able to generate an important technical breakout to the upside.
Despite this breakout, it is far from clear that the price will go much higher. It might form a bearish double top pattern at about 93.50 if the inflective high at is challenged and holds.
As the price is going to be driven by governments fighting to push the price higher or keep it lower, and as the USA wants it lower but faces a headwind there, I think trading crude oil for the time being will be a fool’s errand. I will stay out and that is probably going to be a wise course for most traders.
WTI Crude Oil Spot Daily Price Chart
Ethereum
The crypto sector has been on a roll ever since the US Treasury started supporting the long end of the bond market a few of weeks ago. We can now add to that a short squeeze, institutional ETF purchases, and generally easier financial conditions, although the hawkish tilt the Fed seems to have started taking might put a dampener on that.
In any case, we have seen major cryptos rise strongly and reach new highs. Usually, such rallies are led by Bitcoin, but this time, Ethereum is the one that looks most interesting as a potential long trade, as its moving averages support the bullish case better and the impending breakout looks more dramatic.
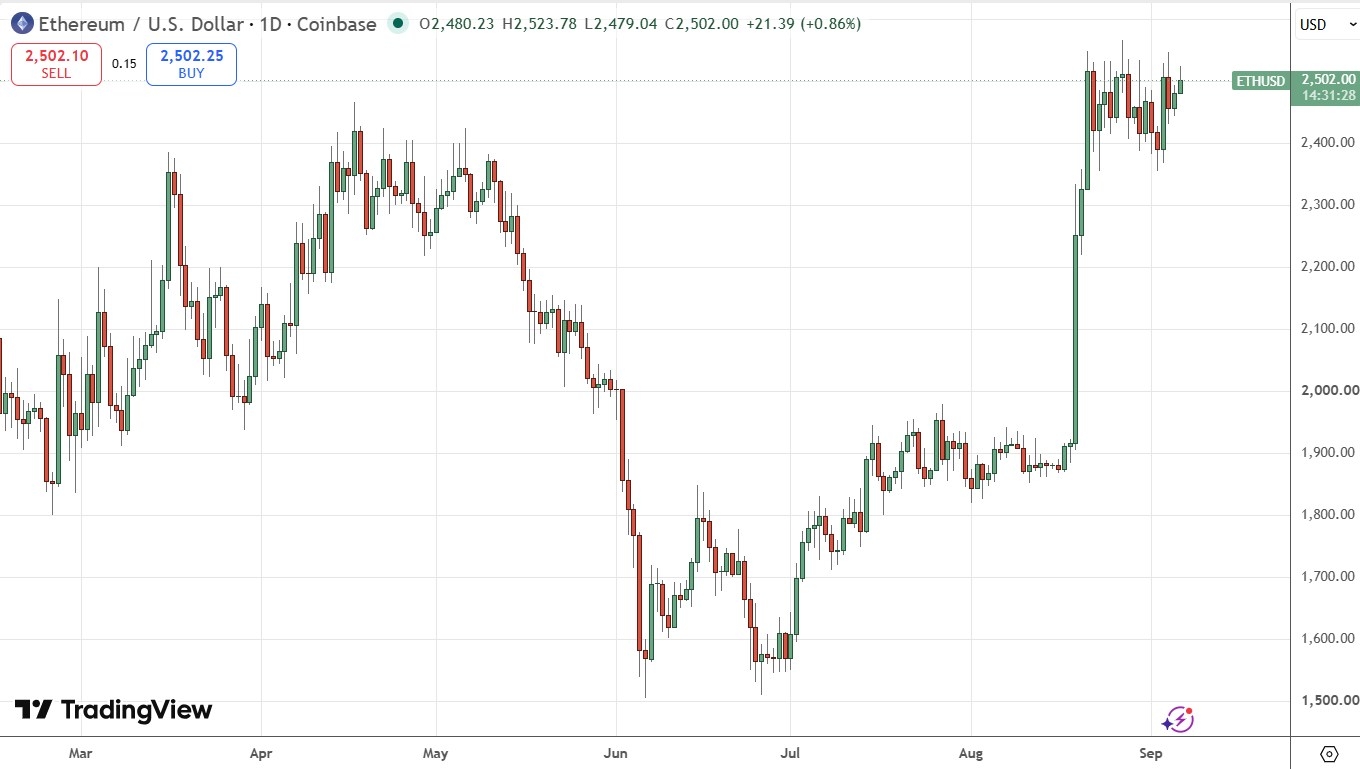
The daily Ethereum price chart below shows how the pair shot up and then for the past couple of weeks, traded in a fairly tight but very even range. This looks like a temporary bullish consolidation that will eventually be broken to the upside.
I will be happy to take a long trend trade of Ethereum if we get a daily close above the $2,515 level (note also how the major quarter-number at $2,500 has acted as resistance, potentially reinforcing the significance of the current consolidation.
Ethereum Daily Price Chart
Bottom Line
I see the best trades this week as:
Long of Sugar following a new 1-year high daily closing price.
Long of Soybeans.
Long of Ethereum following a daily close above $2,515.
Long of the following Yen crosses:
CHF/JPY
EUR/JPY
GBP/JPY
NZD/JPY
Ready to trade our Weekly Forex forecast? Check out our list of the best Forex brokers.