


Fundamental Backdrop and Market Sentiment
I wrote on 20th September that the best trades for the week would be:
Long of Soybeans. Soybean futures rose by 1.15%.
Long of Ethereum. Ethereum rose by 2.34%.
The total win of 3.49% averages 1.75% per asset.
A summary of last week’s most important data in the market:
Swiss National Bank Policy Meeting - The 0% rate decision was expected; what mattered for the Franc was that the SNB saw little need to tighten soon and eased its language on defending against Franc strength. This helped weaken the Swiss Franc.
Australia Unemployment Rate – the unemployment rate rose unexpectedly to 4.6% but this had little effect upon the Australian Dollar.
Last week’s markets were pulled between two powerful forces: expectations of further interest-rate rises and hopes that diplomacy might ease the Middle East oil shock. Strong business-activity data and persistent concern about fuel-driven inflation sent US government bond yields sharply higher; the 10-year US Treasury yield briefly traded as high as 5.22%. The US Dollar made a second consecutive weekly gain, leaving the Euro under pressure, while the Yen recovered on Friday after renewed Japanese warnings threatening intervention against its weakness, making a gain over the week. Equities proved more resilient than bonds: falling oil prices helped US stocks finish the week higher, led by technology shares, even as higher yields threatened to make that rally harder to sustain.
Top Regulated Brokers
Crude oil was the market’s other decisive influence. Traders had marked prices down on hopes that US–Iran talks could lead to a reopening of the Strait of Hormuz; Brent nevertheless finished Friday at $104.32 per barrel and US crude at $92.41. That made the weekend’s news especially significant. President Trump confirmed that he had rejected Iran’s conditional ceasefire proposal, which included reopening the strait, while The Wall Street Journal reported—citing unnamed US officials—that he expects bombing to resume after the November midterm elections.
This might restore some geopolitical risk premium when trading resumes: a failed diplomatic route makes a prompt return of oil flows through Hormuz less certain, while the possibility of renewed strikes raises the risk of further supply disruption. The opposite remains possible if negotiations continue or shipping conditions improve. For now, the practical question for oil traders is whether the prospect of more available crude that drove Friday’s selloff still looks credible after Saturday’s rejection.
The Week Ahead: Key Data and Events to Watch
Next week will see notably more in the way of highly important data items, with several vital releases from the USA and Australia. The coming week’s most important data points, in order of likely importance, are:
US Core PCE Price Index – this is a key US inflation metric that is closely watched by the Fed.
US Average Hourly Earnings – also important to the Fed.
US Final GDP
US Non-Farm Employment Change
RBA Cash Rate & Rate Statement – the RBA is expected to hike by 0.25%. With recent weakness in the AUD, a failure to hike could see a significant move lower.
Australia CPI (Inflation) – this might affect the market’s expectation of any further hikes on the current rate path.
US Unemployment Rate
It is a public holiday in Canada on Wednesday.
Monthly Forex Forecast: September 2026 Overview
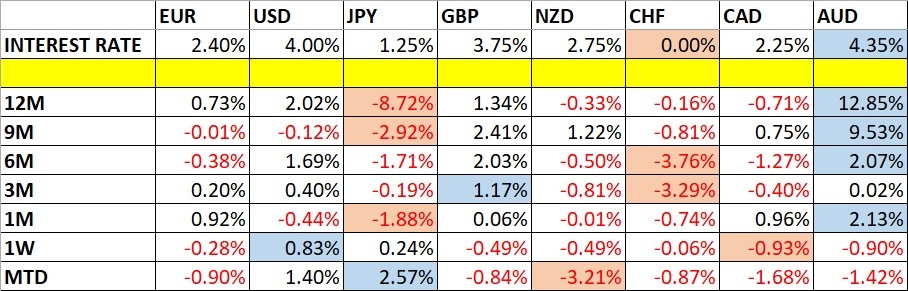
For the month of September, I made no forecast, as the US Dollar had no real long-term trend. It is starting to look as if there may be an emerging long-term bullish trend.
Weekly Forecast 27th September 2026
There were no excessive moves in currency crosses last week, so I made no forecast.
Volatility declined last week, with 19% of the notable currency pairs and crosses moving by more than 1% in value. Next week’s volatility is likely to be much higher.
You can trade these forecasts in a real or demo Forex brokerage account.
Technical Overview and Key Levels
Key Support and Resistance on Major FX Pairs
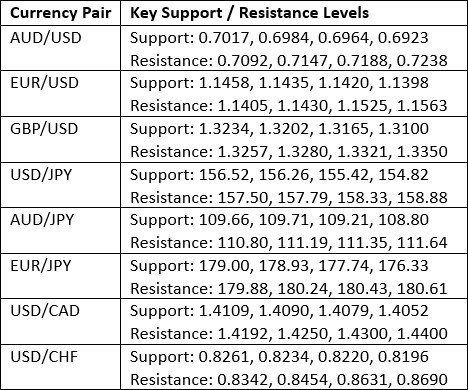
Key Support and Resistance Levels
US Dollar Index
The US Dollar printed a bullish candlestick of healthy size last week, but it did include a meaningful upper wick which formed not far from the resistance level at 101.39. Just above that level sits an 18-month high. This will be the next significant obstacle for US Dollar bulls, and if they can push the price solidly beyond that, it could rise much further.
There is a clear long-term bullish trend on most momentum metrics, which gives Dollar bulls a tailwind. Additional supportive factors include relatively high US Treasury Yields, with even the 10-Year reaching well above 5%, and increasing market expectations of Fed rate hikes, with two further hikes of 0.25% by 2027 now seen as likely by the market, backed by the Fed’s increasingly hawkish rhetoric against inflation.
I think there are good reasons to take a bullish bias here but watch out for the resistance level at 101.39.
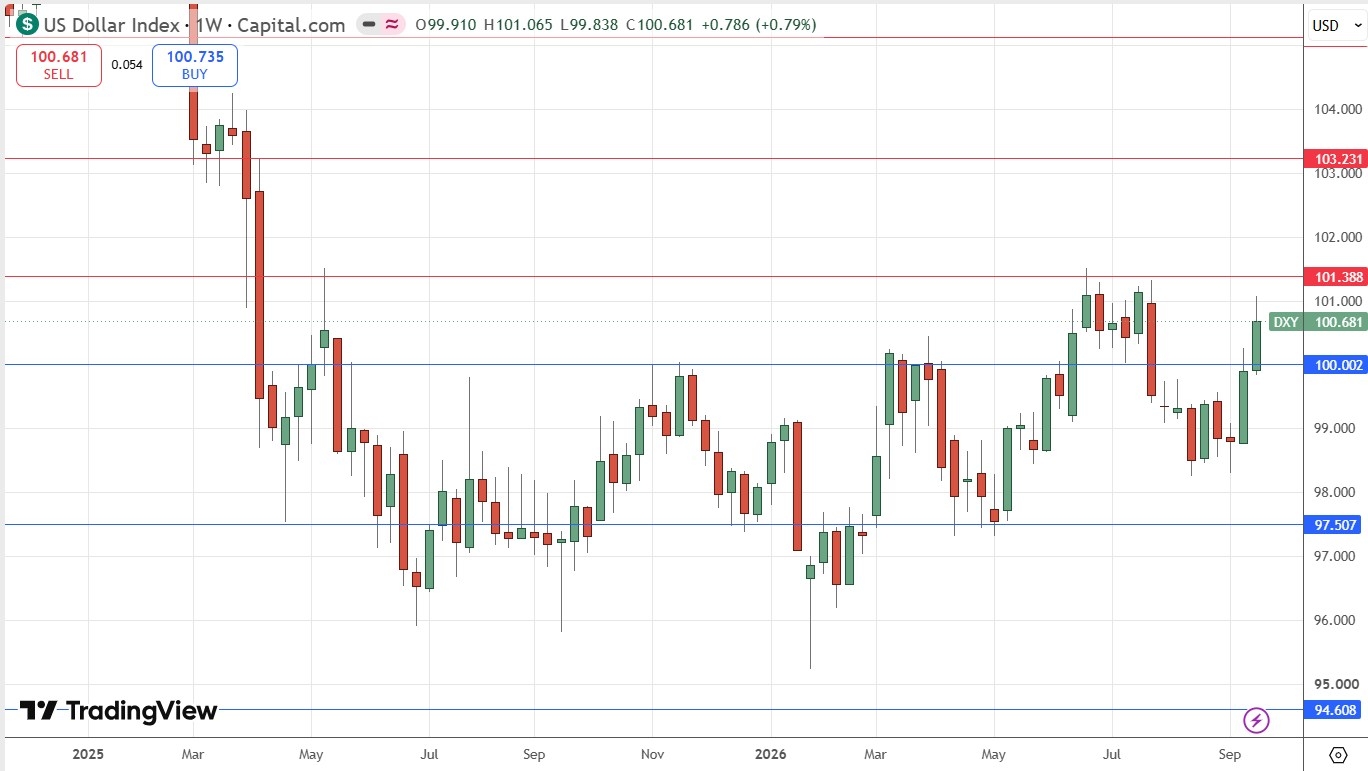
US Dollar Index Weekly Price Chart
EUR/USD
The EUR/USD currency pair is now within sight of a very significant 18-month low below 1.1400. The US Dollar is gaining against many other currencies and has seen a significant bullish breakout. The US Dollar has the strength and size to move the entire Forex market, and when it moves the Euro it is the most significant of all as the Euro is such a large percentage of the US Dollar Index and the US Dollar’s trade.
This currency pair has also tended to trend very reliably.
If the US Dollar continues to push this currency pair lower and we see a daily close below 1.1385, and as long as the 50-day moving average is below the 100-day moving average (we are not quite there yet) when that happens, trend-following funds and institutions will be going short and I will be hopping on for the ride.
I must admit, there are some lower wicks at the most recent price action in this area which makes a short trade a little intimidating, but I will be taking this trade nonetheless.
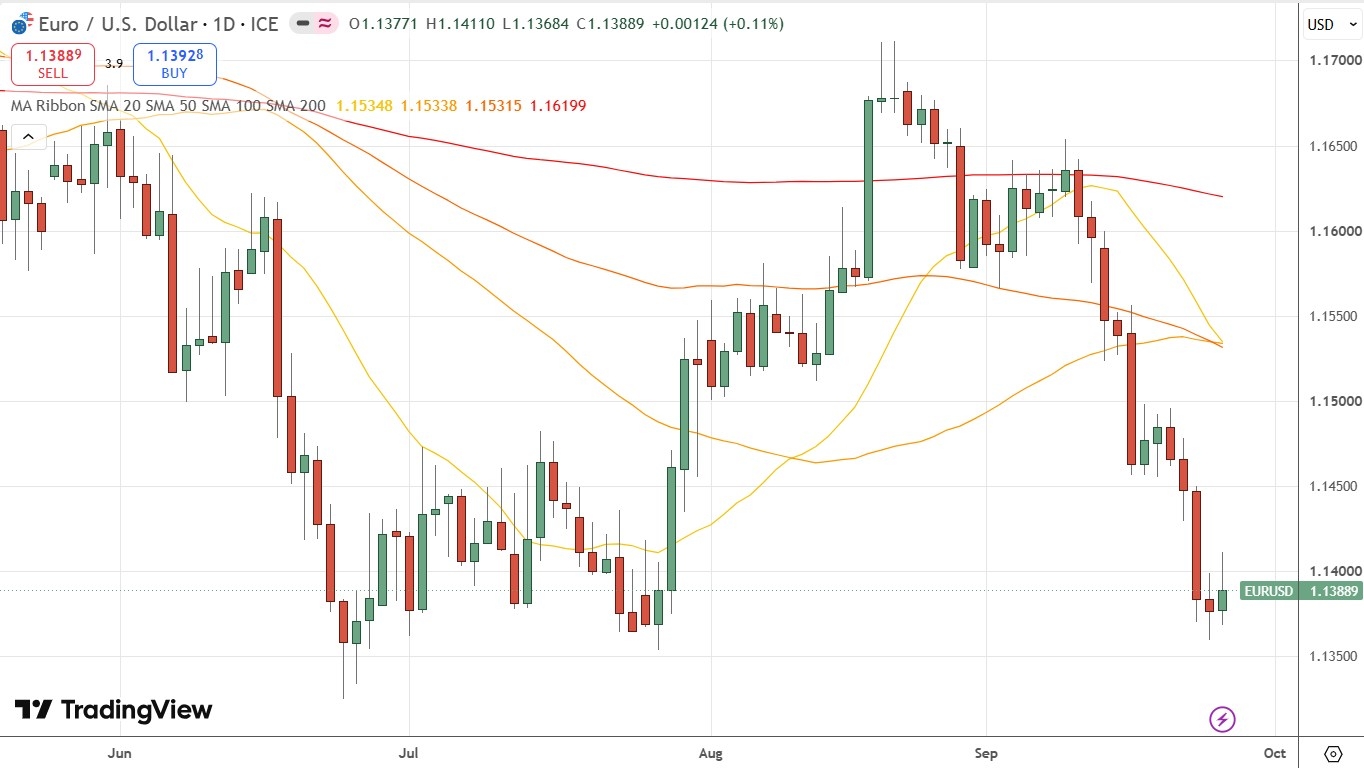
EUR/USD Daily Price Chart
Soybean Futures
Soybean Futures again got close to making another new 2.5-year high price last week but fell slightly short of doing so. It was still an up week, and the price action is coiling in a bullish consolidation just under the high which is an exciting suggestion that a further breakout is likely.
There are signs that this trend could be unusually reliable, as for several months the price action has been almost completely held by ascending price channel drawn via the linear regression anlaysis study visible in the price chart below. The latest breakout sent the price above the top of the channel, which was a bullish sign that continues to hold.
If you have not entered this trade yet then it is worth considering, because being long of commodities at long-term bullish breakouts has historically been a very profitable trading strategy. It might be wise to control risk by entering with half the normal position size, as the move might be very over-extended. However, the consolidation over the past couple of weeks makes me think a full size entry on the breakout is looking sensible again.
The price of Soybeans has been rising in recent months as markets have started to price in Black Sea disruption due to the Russia/Ukraine war but even more importantly, stronger Chinese buying plus late-season crop risk.
If Soybean futures are too big for you, consider an alternative ETF like SOYB which is much more affordable. This ETF has also lately been performing better than the futures contracts.
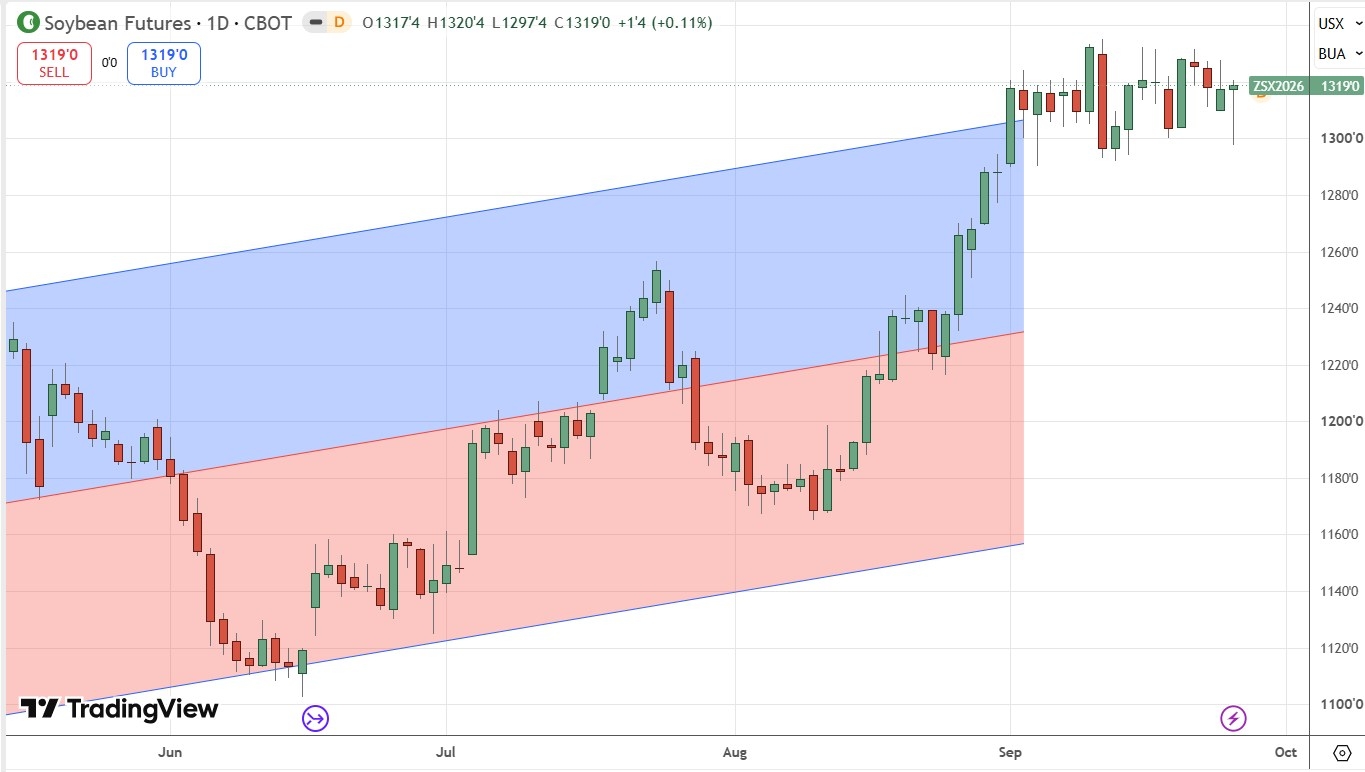
Soybean Futures Daily Price Chart
WTI Crude Oil
WTI Crude Oil fell last week, but that is not the most important part of its story. President Trump’s reported rejection of an Iranian peace offer and reported belief that he will resume a larger military campaign against Iran in November after the US mid-term elections will likely be the catalyst that drives WTI higher when the markets reopen later for the coming week.
As has been the case for many months, what happens militarily and geopolitically in the Strait of Hormuz and in the Gulf is the main driver here, making trading unpredictable.
Having said that, we have a nice confluence of a continuing bullish breakout beyond the initial postwar descending trendline, coupled with a confluence of the lower edge of a linear regression analysis of the bullish move from the lows and horizontal support at 87.68, making a potential long trade following a bullish bounce there very attractive.
Day traders might find this an interesting asset if they are not trading at night in the Middle East, so the risk-on or risk-off tone is hopefully established for the trading session for a day trader, then crude can be traded intraday in that direction.
Longer-term traders might do well to look for buying opportunities if they think a resumption of the war is going to happen after the mid-terms, but they might need to be quick to take profit, as President Trump tends to make moves pretty quickly to bring down the price of Crude Oil once it exceeds $100.
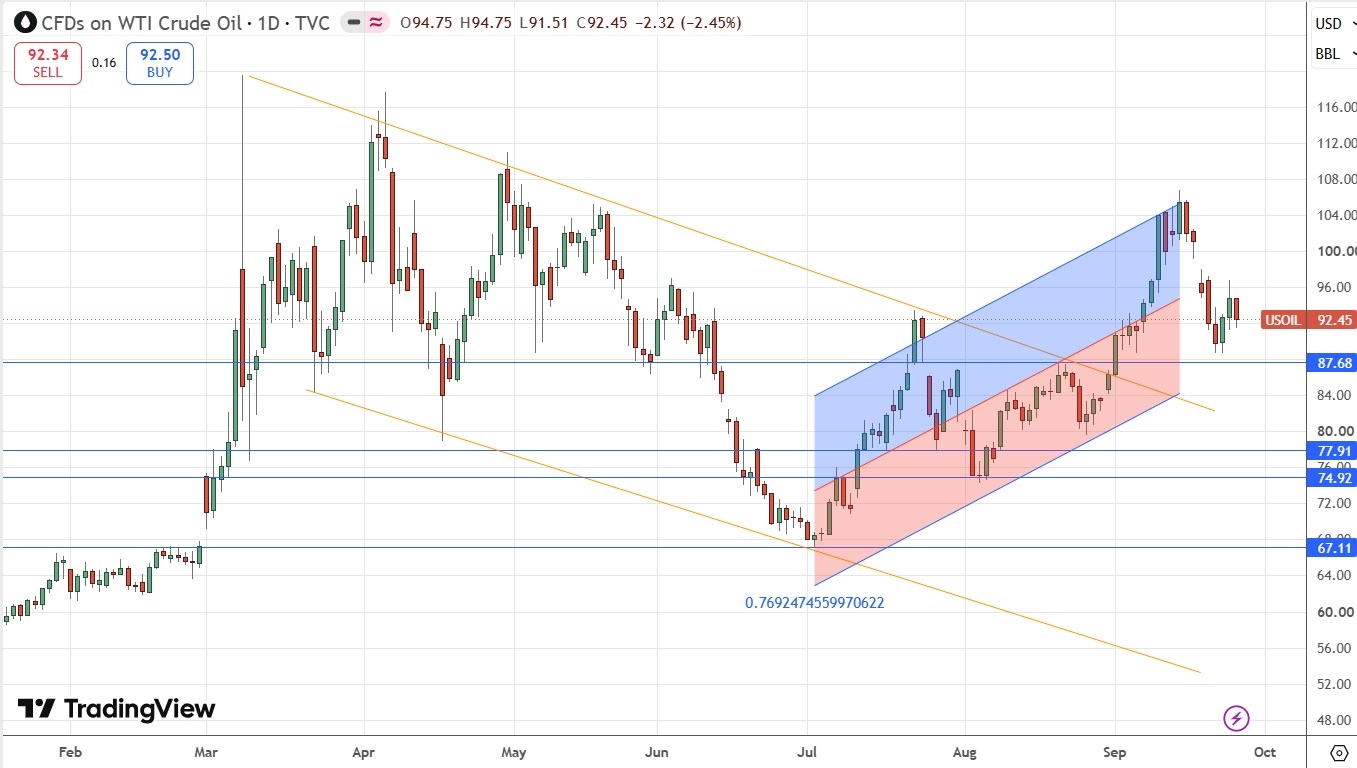
WTI Crude Oil Spot Daily Price Chart
Ethereum
The crypto market has cooled slightly after Ethereum printed a new multi-month high over the previous week. Note that Bitcoin did not manage to do the same, despite its renewed bullish movement.
So, Ethereum looks unusually interesting, as it made a bullish consolidation that was quite narrow for over two weeks, before finally making a strong bullish breakout, and is now making a bullish bottom off the new support level which represents that earlier breakout.
I like to take long-term bullish breakouts in commodities and cryptocurrencies, so I will be maintaining my long Ethereum position which I took one week ago. I think if the wider market environment becomes more risk-on, we will see Ethereum and Bitcoin shoot higher.
The quality of the earlier breakout from this narrow consolidation looks quite high, and that is another reason to feel more optimistic about this trade. Yet when trading breakouts, you always must be prepared for the possibility of failure, and to use a trailing stop, to achieve long-term success trading this kind of method.
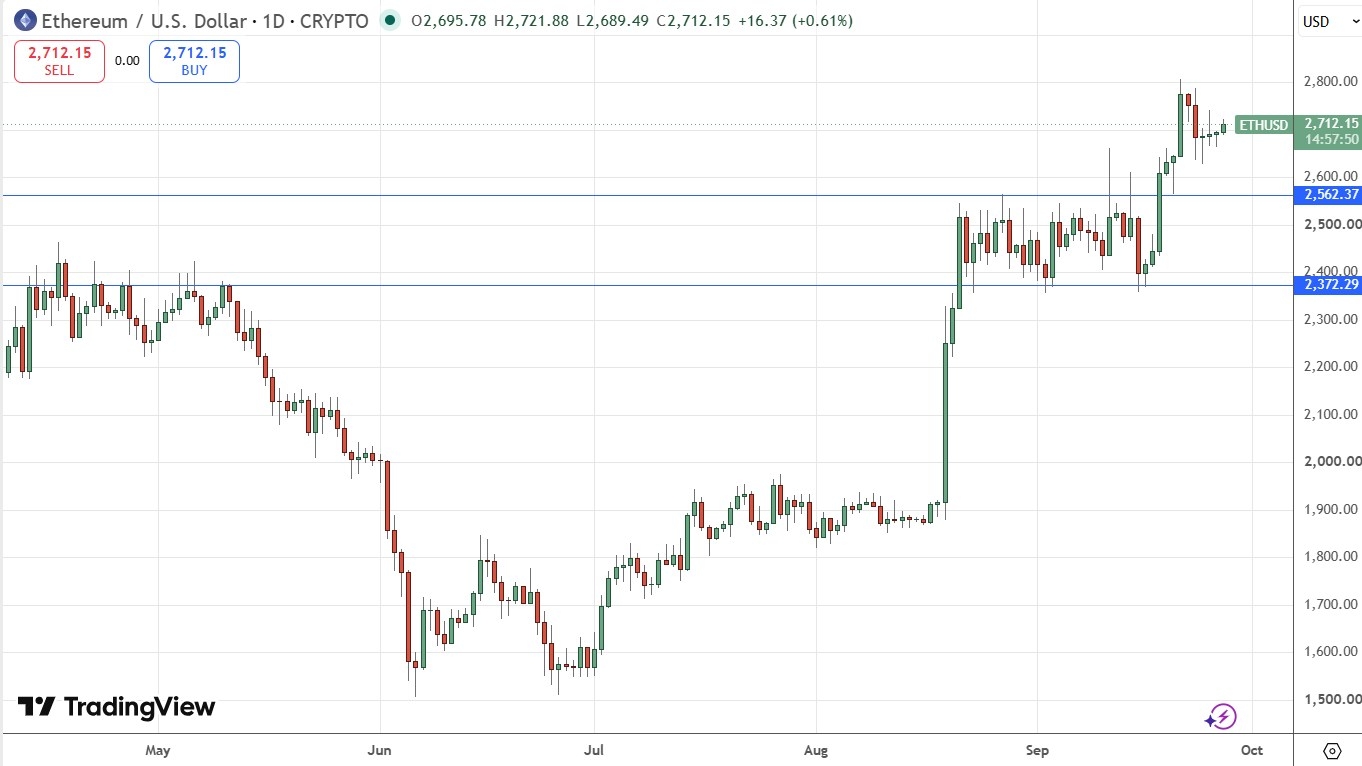
Ethereum Daily Price Chart
Bottom Line
I see the best trades this week as:
Long of the S&P 500 Index following a daily close above 7803.
Short of the EUR/USD currency pair following a daily close below 1.1358.
Long of Soybeans.
Long of Ethereum.
Ready to trade our weekly Forex forecast? Check out our list of the best Forex brokers.