


The market environment has changed into one with a strong US Dollar that is overcoming most other currencies – including this one, and an increasingly risk-off environment which can be seen in stalled and slowly declining stock markets. Additionally, there are big news events ahead scheduled for both currencies within the GBP/USD currency pair, that might produce a stronger, longer-lasting trend than any we have seen lately: central bank meetings tomorrow and Thursday, plus crucial CPI (inflation) data for the British Pound. While these events are ongoing, we can probably expect volatility, but if it does end up driving direction decisively, the correct direction might not be immediately obvious.
Top Regulated Brokers
The GBP/USD currency pair is certainly going to be one of the pairs in the focus of Forex analysts today, despite the dominance of Forex action by the Japanese Yen over the past few days.
GBP/USD Fundamental Analysis
The US Dollar has a mildly bullish fundamental backdrop going into the Fed decision, but market conviction is fragile; the British Pound is supported by resilient UK activity and a relatively hawkish rates outlook, though energy-driven inflation and growth risks keep the outlook balanced. However, sentiment is much more bullish on the US Dollar than the British Pound, because markets are pricing in an approximately 90% chance of a rate hike by the Fed tomorrow, while the Bank of England is not seen as being on such an urgent or decisive path – no rate hike is expected by the Bank of England at its policy meeting which will be held this Thursday.
GBP/USD Technical Analysis
When we zoom out to a daily or longer-term chart, the price action looks consolidative: the price has been making a range between approximately 1.3650 and 1.3100 for more than the past year. Drilling down, however, shows that the price action has fluctuated between several short-term trends, but they are quite well-defined when they happen and are often contained within a symmetrical price channel of some reliability.
A look at the H1 price chart below covering recent days shows a succession of price channels, with the current one being a bearish channel holding since 9th September – and all the channels are contained within the several linear regression analysis studies within the price chart. This suggests we are currently in a bearish trend, and the price is more likely to fall than rise.
This bearish analysis is supported by the price action itself, which made a notable lower high which rejected a new resistance level at 1.3513. We also see a new resistance level formed just below 1.3500 which was acting as support a few days ago, which is another bearish sign.
The price is trying now to break below the five-week low at 1.3465. There have been several attempts at this low, which might take a few hours or even longer to overcome. We could usually expect such a low to hold ahead of the high-impact data points tomorrow and Thursday, but with an overall strong pro-USD risk-off sentiment taking hold, we might even see such a bearish breakdown today.
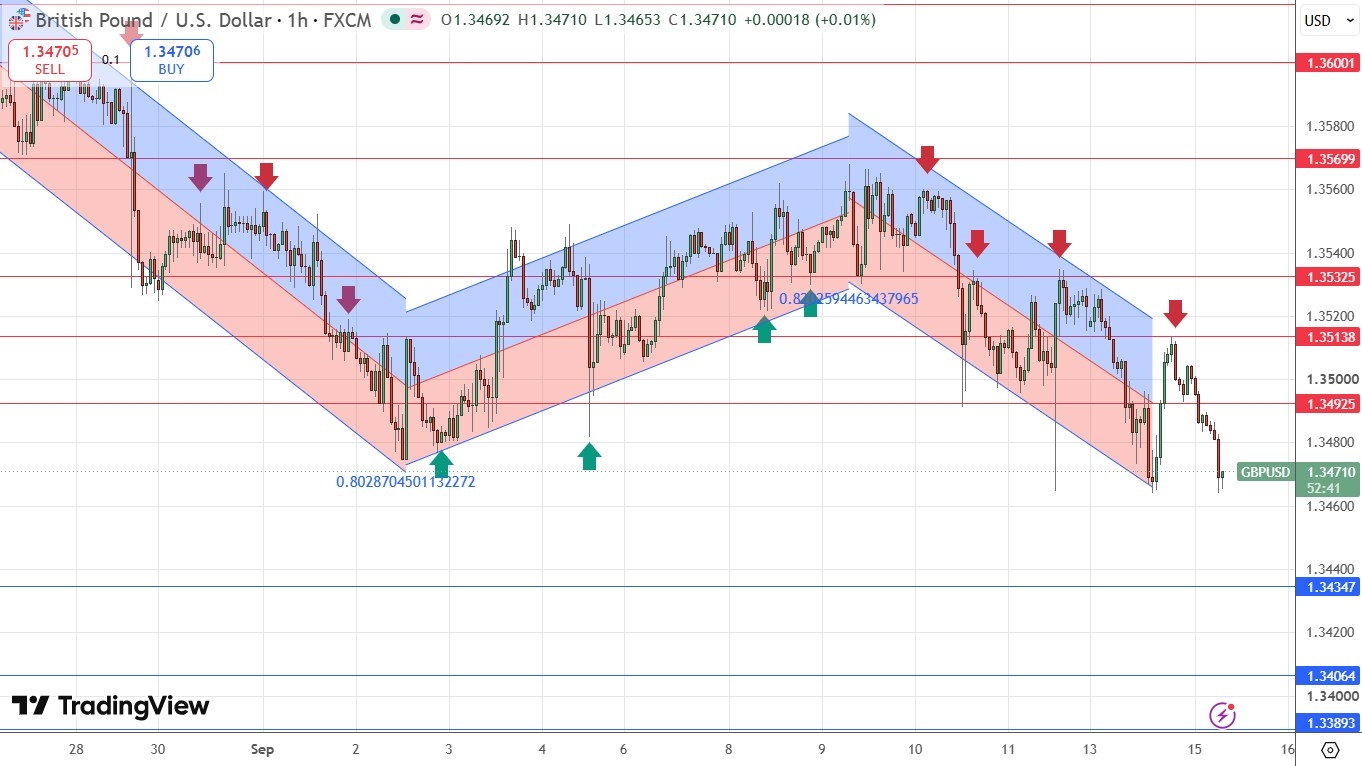
GBP/USD H1 Price Chart – Short-Term Price Channels
My Take on the GBP/USD
I see the best opportunities here that might set up today as a short trade from a bearish rejection of the nearest resistance level at 1.3493. This currency pair often does well on breakouts, but I don’t see going short below the current low of the day as looking likely to succeed given the price looks a little exhausted, or at least distributive, down there right now. An entry there should take you back down to 1.3465 at least, but that level might hold ahead of the Fed data release tomorrow.
Review, Support & Resistance Levels
My previous GBP/USD free signal on 9th September could have produced a break even long trade from 1.3530, which contained the low of the London and New York sessions that day.
Risk 0.75%.
Trades may only be entered prior to 5pm London time today.
Long Trade Ideas
Go long following a bullish price action reversal on the H1 timeframe immediately upon the next touch of $1.3435, $ 1.3406, or $1.3389.
Put the stop loss 1 pip below the local swing low.
Adjust the stop loss to break even once the trade is 25 pips in profit.
Take off 50% of the position as profit when the price reaches 25 pips in profit and leave the remainder of the position to run.
Short Trade Idea
Go short following a bearish price action reversal on the H1 timeframe immediately upon the next touch of $1.3493, $1.3514, or $1.3533.
Put the stop loss 1 pip above the local swing high.
Adjust the stop loss to break even once the trade is 25 pips in profit.
Take off 50% of the position as profit when the price reaches 25 pips in profit and leave the remainder of the position to run.
The best method to identify a classic “price action reversal” is for an hourly candle to close, such as a pin bar, a doji, an outside or even just an engulfing candle with a higher close. You can exploit these levels or zones by watching the price action that occurs at the given levels.
There is nothing more scheduled today concerning either the British Pound or the US Dollar.
Ready to trade our free Forex signals? Here is our list of the best Forex brokers worth checking out.