


Bearish view
Sell the BTC/USD pair and set a take-profit at 70,000.
Add a stop-loss at 83,000.
Timeline: 1-2 days.
Bullish view
Buy the BTC/USD pair and set a take-profit at 83,000.
Add a stop-loss at 70,000.
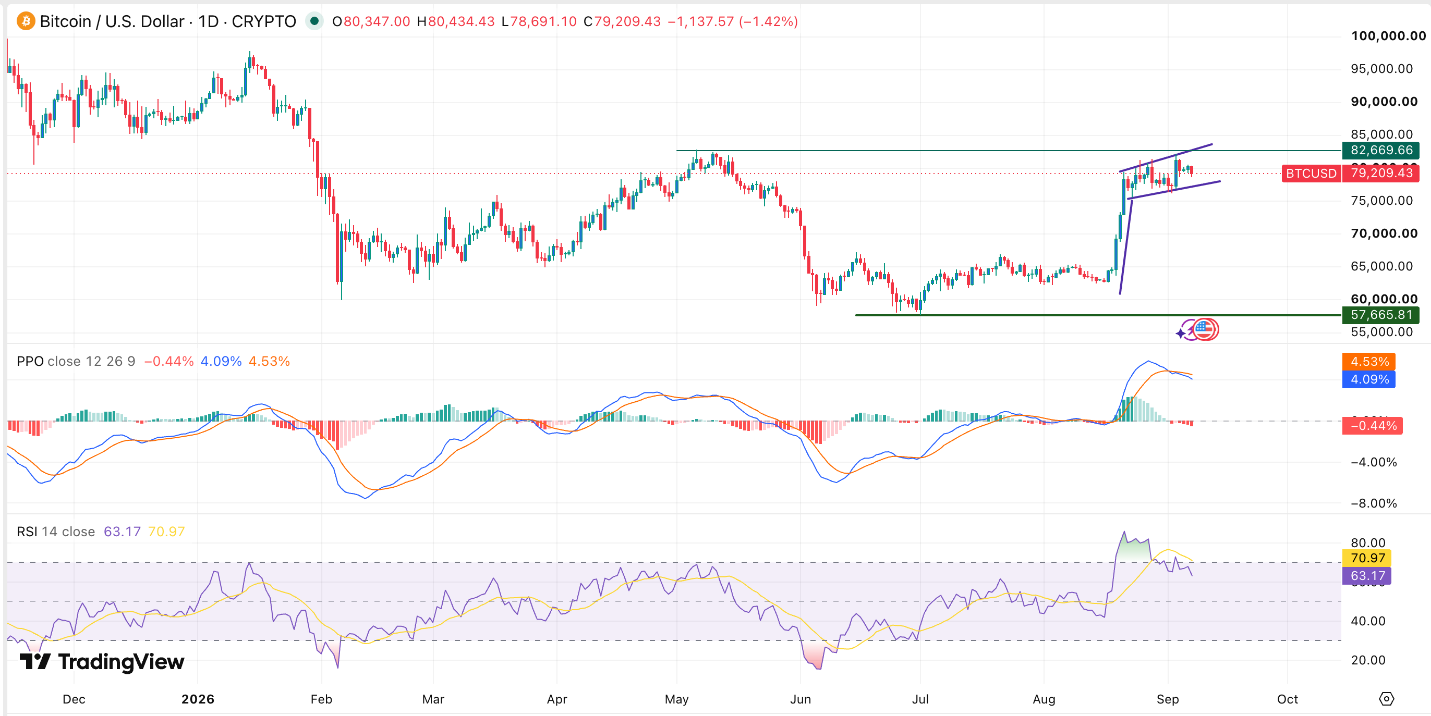
Bitcoin has moved sideways since August 21 as the recent rally lost momentum. BTC/USD traded at 79,205 on Tuesday morning, still well above last month's low of 57,665. This consolidation has continued even as demand among American investors has remained strong.
Americans have continued accumulating Bitcoin ETFs this year. These funds have recorded over $770 million in inflows this month, continuing a trend that started in July when they added $172 million. They added a whopping $3.5 billion last month, with total assets jumping to over $101 billion.
Top Regulated Brokers
Bitcoin is also seeing strong demand from companies, with Strive and Strategy being among the top buyers. There are chances that Strategy continued buying Bitcoin last week, now that STRC has jumped and moved closer to par.
The BTC/USD pair has wavered because of the ongoing US-Iran crisis that has pushed crude oil prices higher. Brent and WTI have jumped to $97 and $92, respectively. The average gasoline price has jumped to $4.1, while diesel soared to a record high.
These numbers mean that the Federal Reserve may decide to hike interest rates as soon as next week. This view will be confirmed if the upcoming US inflation report is stronger-than-expected. The average estimate among analysts is that inflation remained above 2% in August.
BTC/USD Technical Analysis
The daily chart shows that the BTC/USD pair jumped from a low of 57,665 on July 1 this year to a high of 82,670. Its upper side coincided with the highest level in May this year.
On the positive side, Bitcoin has remained above the 50-day Exponential Moving Average (EMA), a sign that bulls are in control. It has also formed a bullish flag pattern, which normally leads to a continuation.
The risk, however, is that the two lines of the Percentage Price Oscillator (PPO) have formed a bearish crossover. Also, the Relative Strength Index (RSI) has dropped below the overbought level of 70.
Therefore, there is a risk that Bitcoin will drop and retest the support level of 70,000. On the positive side, a move above this month’s high of 82,670 will invalidate the bearish outlook.
Ready to trade our free Forex signals? Here are the best MT4 crypto brokers to choose from.