


Bullish view
Buy the BTC/USD pair and set a take-profit at 91,000.
Add a stop-loss at 82,135.
Timeline: 1-2 days.
Bearish view
Sell the BTC/USD pair and set a take-profit at 82,135.
Add a stop-loss at 91,000.
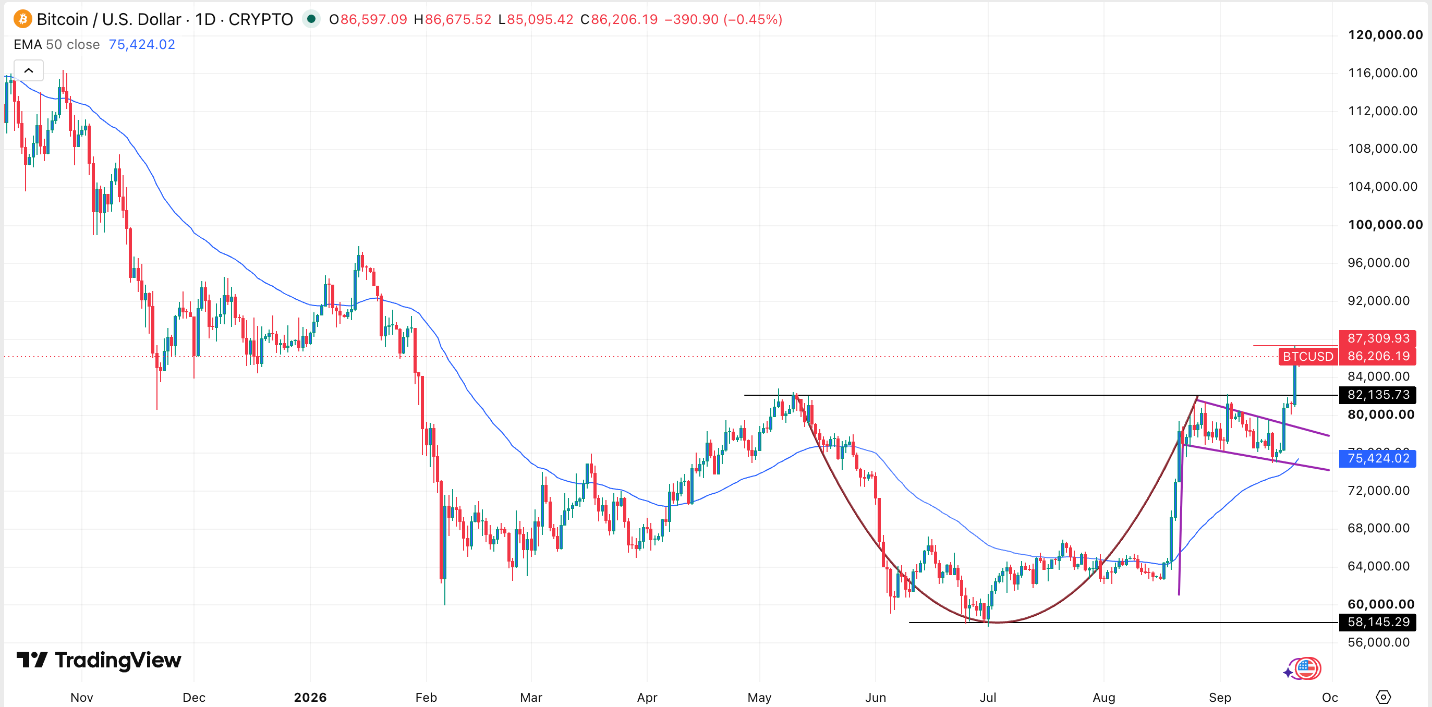
Bitcoin's price has remained in a bull market this year and is now hovering at its highest level since January. The BTC/USD pair peaked at 87,310, up 50% from its lowest level this year, as demand continues to rise.
Top Regulated Brokers
Bitcoin Price Jumps as Demand Rises
Bitcoin has made a strong bullish breakout this year, helped by the rising demand among retail and institutional investors. Data shows that spot Bitcoin ETFs have had over $1 billion in inflows this week and over $1.5 billion this month. In total, these funds have added over $5 billion in assets in the last three months.
BlackRock’s IBIT has over $68 billion in assets, and is followed by funds from companies like Fidelity, Grayscale, and Bitwise. Strategy, the biggest Bitcoin holder in the world, bought 950 coins last week.
The same trend is happening in the futures market, where the open interest has continued rising. Data shows that the 24-hour open interest has jumped to over $61.2 billion. The interest has been in a strong upward trend after bottoming at $45 billion during the crypto winter.
Bitcoin rally continued as crude oil prices dropped. Brent, the global benchmark, dropped to $98.56, while the West Texas Intermediate (WTI) fell to $89.92. Oil prices dropped as traders predicted that the US and Iran may reach a deal. Lower oil prices mean that the Federal Reserve may decide not to hike interest rates again this year.
BTC/USD Technical Analysis
The daily chart that the BTC/USD pair has continued rising in the past few months. It has soared from a low of 58,145 in July to a high of 87,310. It recently crossed the important resistance level of 82,135, its highest level in May this year.
The pair has moved above the upper side of the bullish flag pattern, which often leads to more gains. It also moved above the upper side of the cup-and-handle pattern, a common continuation sign in technical analysis.
Bitcoin has held steady above the Ichimoku cloud indicator, which is a bullish sign. Also, the Relative Strength Index (RSI) has continued rising. Therefore, the pair will likely continue rising as bulls target the key resistance level of 91,000. A drop below the support level of 82,135 will invalidate the bearish outlook.
Ready to trade our free Forex signals? Here are the best MT4 crypto brokers to choose from.