


Bearish view
Sell the BTC/USD pair and set a take-profit at 70,000.
Add a stop-loss at 78,000.
Timeline: 1-2 days.
Bullish view
Buy the BTC/USD pair and set a take-profit at 78,000.
Add a stop-loss at 70,000.
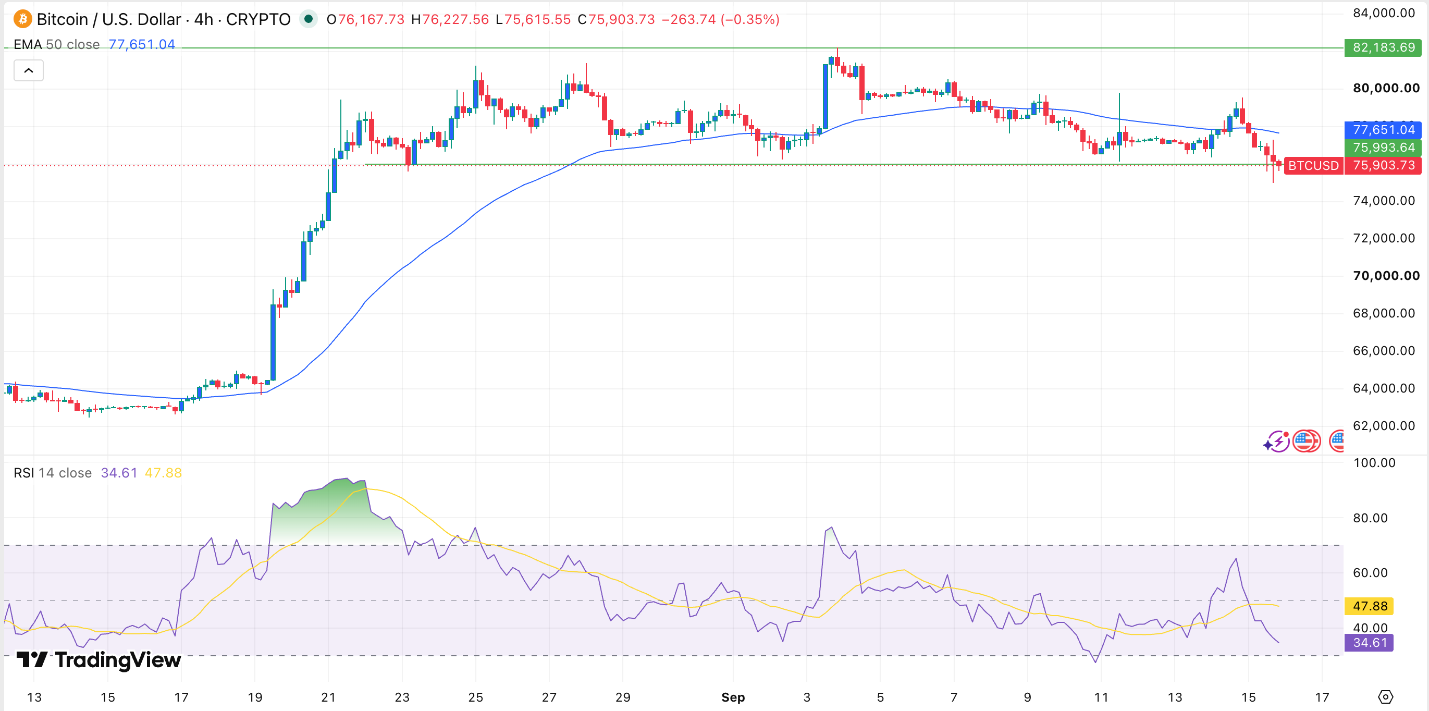
Bitcoin price remained under pressure after the CLARITY Act failed a crucial vote in the United States Senate. The BTC/USD pair fell to 76,000, down by 7.8% from its highest point in August.
Top Regulated Brokers
CLARITY Act Stalls in the Senate
Bitcoin retreated and moved below a crucial support level of 76,000 after the CLARITY Act continued stalling in the Senate. The Senate voted to block the act from advancing, dealing a major blow to the crypto industry.
The bill has stalled in the Senate in the past few months, and the odds of it passing in the Senate have dropped substantially on Polymarket and Kalshi. Republicans had released a version of the bill, adding new ethics restrictions to address concerns about public officials launching tokens. Democrats said that the changes were not enough.
The White House and the crypto industry have been working on the bill, which is the most comprehensive legislation since it passed the GENIUS Act. It would simplify how the industry is regulated, especially by changing moving most of the regulatory authority from the SEC to the CFTC.
To a large extent, the CLARITY Act would not have a major impact on Bitcoin itself. Instead, it would benefit companies like Coinbase, Circle, and Kraken that are involved in the industry.
Bitcoin also retreated as investors reacted to the ongoing risk-oFF sentiment in the US as crude oil and other energy prices continued rising. Brent and the WTI have jumped to over $105 this week, which will push inflation higher for longer than expected.
As a result, there is a risk that US inflation will continue rising this year since diesel has moved to a record high. As a result, markets are now pricing in a 0.25% rate hike this year and another time in December.
BTC/USD Technical Analysis
The four-hour chart shows that the BTC/USD pair has come under pressure in the past few days. A closer look shows that it has already moved below the 50-period moving average.
The pair has also dropped below the key support level of 76,000, the lower side of the head-and-shoulders pattern. H&S is one of the most common bearish reversal signs in technical analysis.
The Relative Strength Index (RSI) and the MACD have continued falling. Therefore, Bitcoin may drop further, potentially to 70,000 in the near term.
Ready to trade our free Forex signals? Here are the best MT4 crypto brokers to choose from.