


Bullish view
Buy the BTC/USD pair and set a take-profit at 81,500.
Add a stop-loss at 76,000.
Timeline: 1-2 days.
Bearish view
Sell the BTC/USD pair and set a take-profit at 76,000.
Add a stop-loss at 81,500.
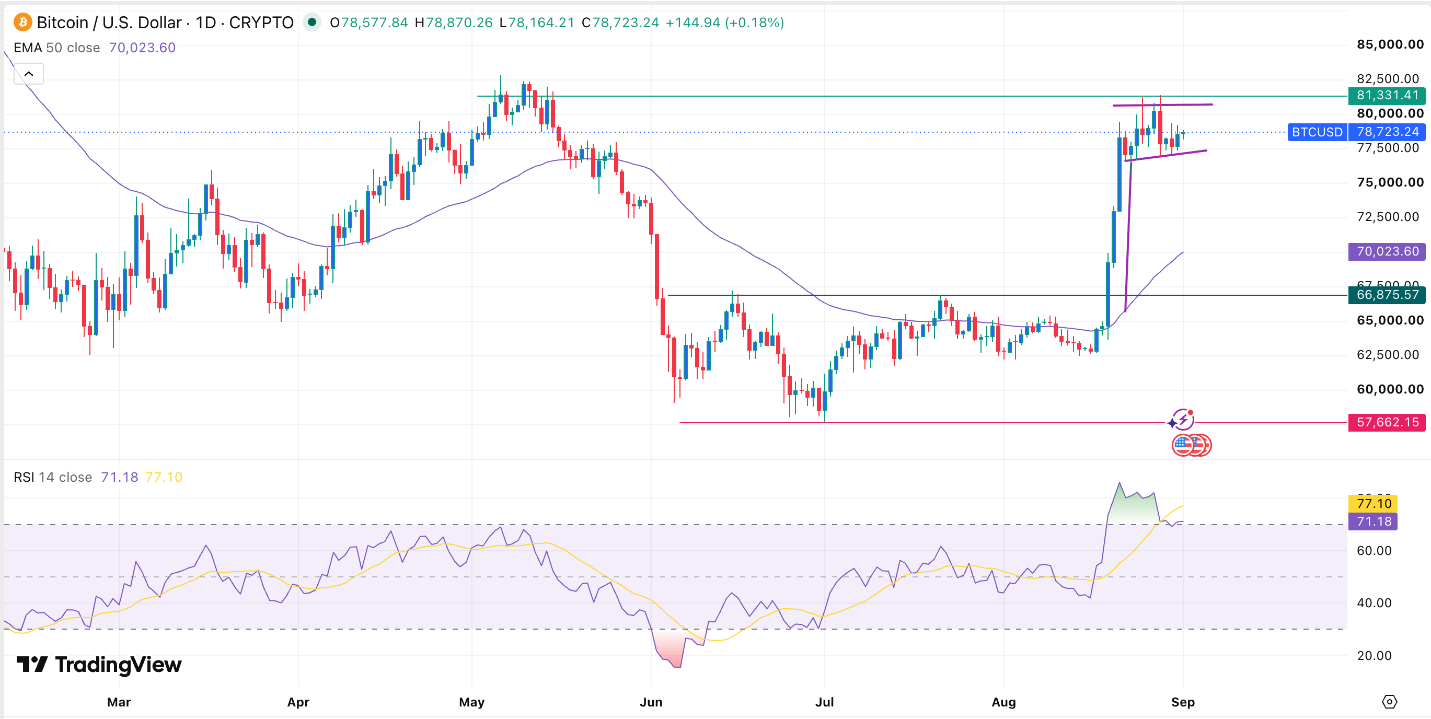
The BTC/USD pair remained in a tight range today, September 1, as the recent rally stalled. Bitcoin was trading at $78,744, a few points below the year-to-date high of $81,330. It remains about 36% above its lowest level this year, and has formed a bullish pattern, pointing to more gains in the coming weeks.
Top Regulated Brokers
Bitcoin Price is Seeing Traction as Volatility in Stocks Rise
The BTC/USD pair had a strong performance in August as it moved from a narrow consolidation phase to its highest level in months. It soared to its highest level since May 12 this year.
The breakout coincided with the end of the rising volatility in the stock market, with the Dow Jones and S&P 500 indices remaining below their all-time highs. Top stocks that led the gains like SanDisk and Micron have all moved to a bear market after falling by over 20% from their highs.
Bitcoin also experienced substantial inflows during the month. ETFs tracking the coin had over $3.5 billion in inflows in August, a big increase from last month’s $172 million. These funds now holds over $98 billion in assets, with BlackRock’s IBIT having the biggest market share.
Still, Bitcoin faces some major challenges. One of them is that inflation remains stubbornly high, with Brent and the West Texas Intermediate (WTI) rising to $91.2 and $85, respectively. Trump resumed his attacks against Iran this week, and according to Axios, he plans to have limited strikes near the Strait of Hormuz.
These strikes will lead to higher oil prices and inflation, pushing the Federal Reserve to maintain a hawkish tone. Bitcoin will next react to the upcoming nonfarm payroll (NFP) data, which will provide more information about the state of the economy.
BTC/USD Technical Analysis
The daily chart shows that the BTC/USD pair has held steady in the past few days. It has remained slightly below last month’s high of 81,330. On the positive side, Bitcoin remains above the 200-day moving average, a sign that bulls have prevailed.
Bitcoin has also moved above the important resistance level of $66,875, its highest level in June and July this year. It is also forming a bullish flag pattern, which is made up of a vertical line and a horizontal channel.
Therefore, the coin will likely have a bullish breakout in the next few days. If this happens, the next level to watch will be at 85,000.
Ready to trade our free Forex signals? Here are the best MT4 crypto brokers to choose from