


The crypto market appears calm as major pairs consolidate in macro ranges that have defined their price actions for the better part of the summer. After stalling at and slightly retreating from key resistance areas, traders may be underestimating the pressure quietly building beneath the surface.
Top Regulated Brokers
The sentiment across market participants remains mixed as the asset struggles to find a definitive direction. A sense of hesitation has taken hold, leaving market participants to wonder whether Bitcoin’s quiet phase is a prelude to a breakout or a sign of buyer exhaustion.
What makes the current market setup for BTC/USD more interesting is not price itself, but how traders respond. Investors are watching closely to see if the recent resilience can translate into sustainable upward momentum. Over the past month, a shift in market structure has altered the prevailing narrative, prompting a deeper look into the underlying dynamics that govern this consolidation, while making a case for a full-blown recovery.
Bitcoin SOPR Signals an Early Bull-Market Recovery
Bitcoin (BTC) is breaking with typical bear-market behavior as the classic Spent Output Profit Ratio (SOPR) metric records its longest bullish streak of 2026.
SOPR measures the extent to which coins moving onchain do so at a higher or lower price compared to the previous transaction.
Data from CryptoQuant reveals that the aggregate SOPR has stayed above its crucial breakeven threshold of 1 for over three full weeks, hovering around 1.002 at the time of writing. This indicates that the vast majority of coins moving onchain are doing so at a profit, reflecting a structural return to bullish market conditions.
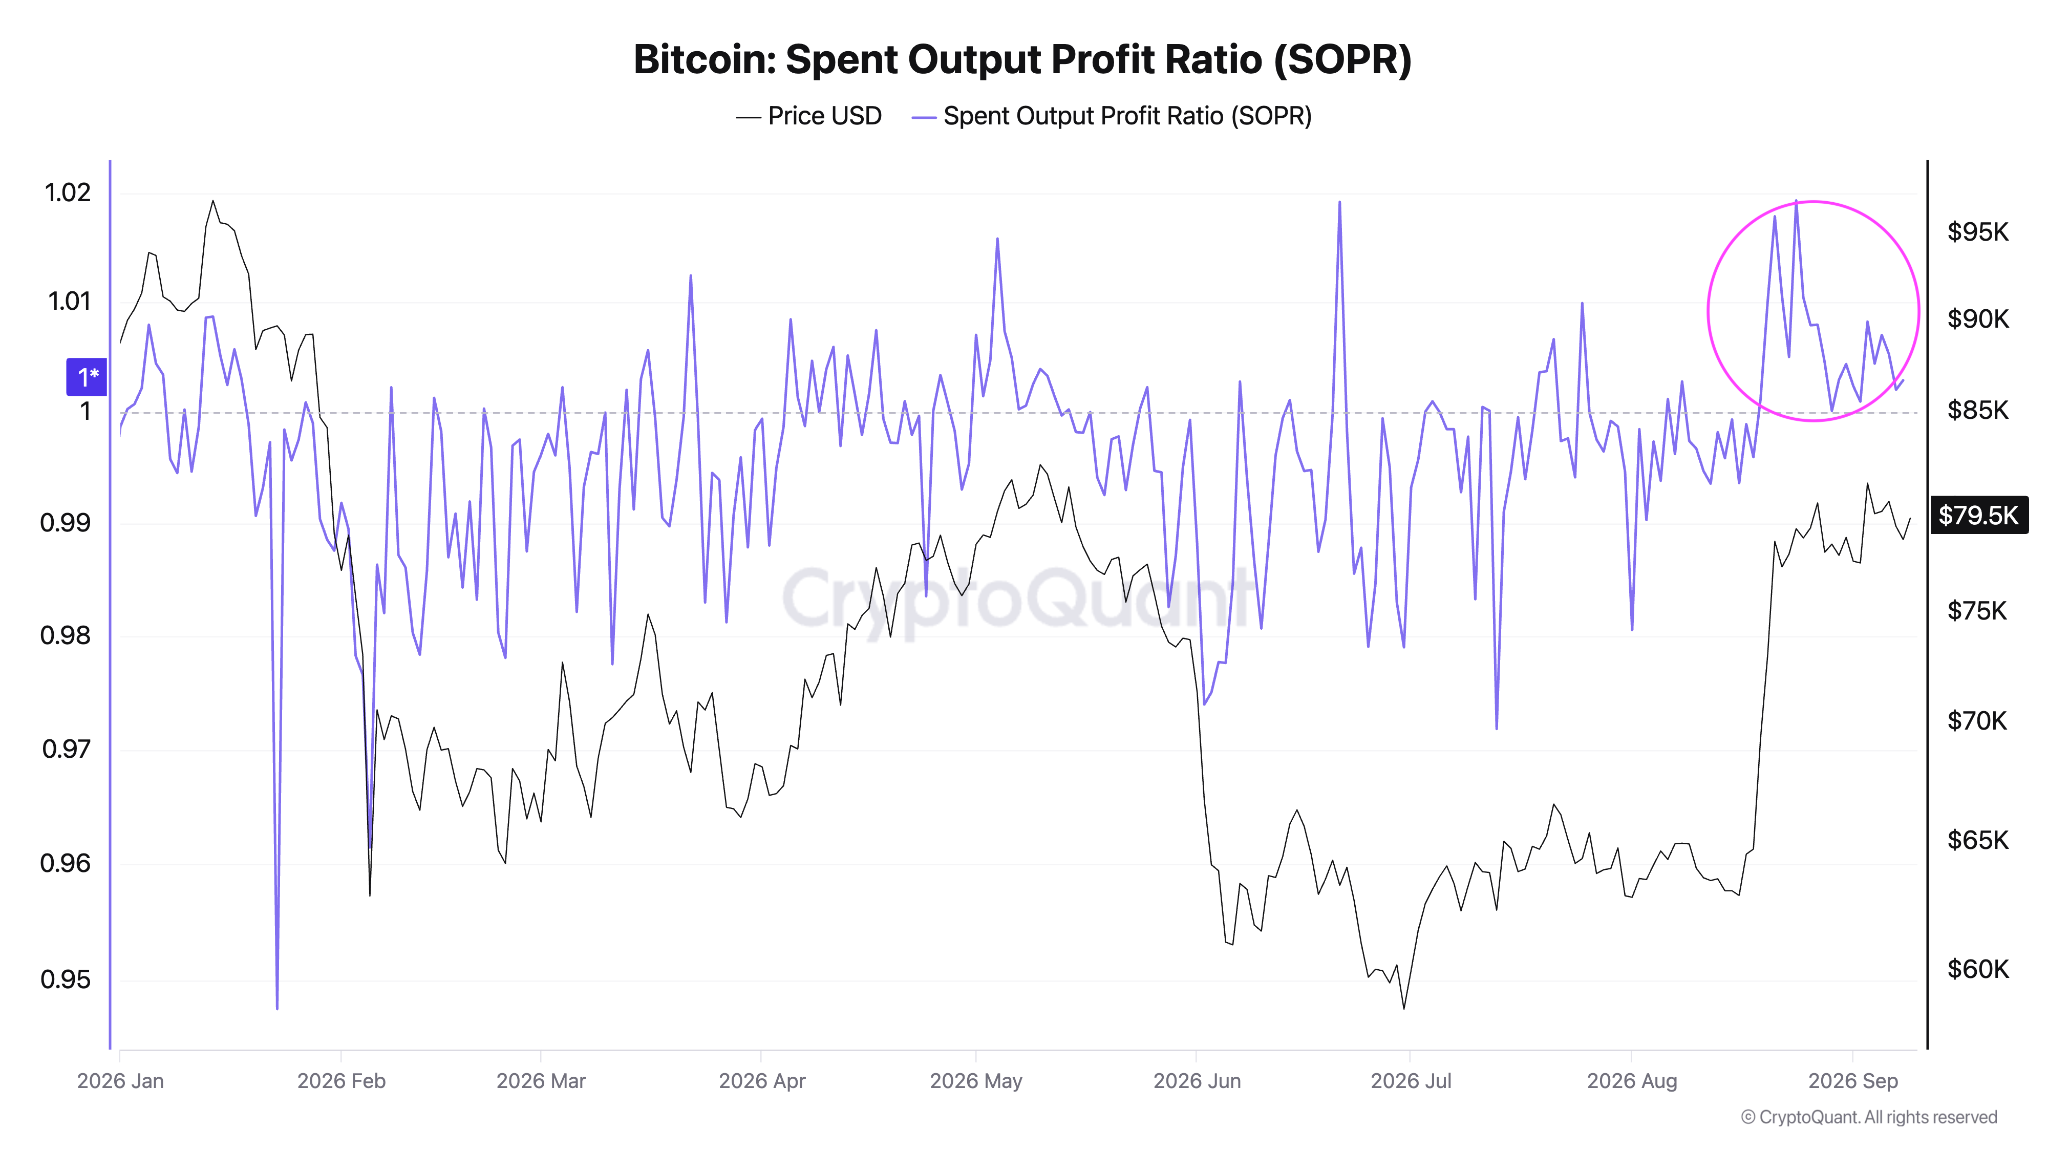
Bitcoin SOPR chart. Source: CryptoQuant
The behavior of different wallet cohorts adds further weight to this recovery case. Commenting on SOPR readings for short-term holders (STHs), wallets holding a UTXO without selling for up to six months, onchain analytics suite Checkonchain added to hopes that Bitcoin is staging a long-term bullish recovery.
““In bear markets, rallies back into profit tend to get sold. In bull markets, short sharp moves below break-even tend to become buy-the-dip setups,” the analytics company in an X post Wednesday, adding:
“The current structure is starting to look more like those early bull-market recoveries.”
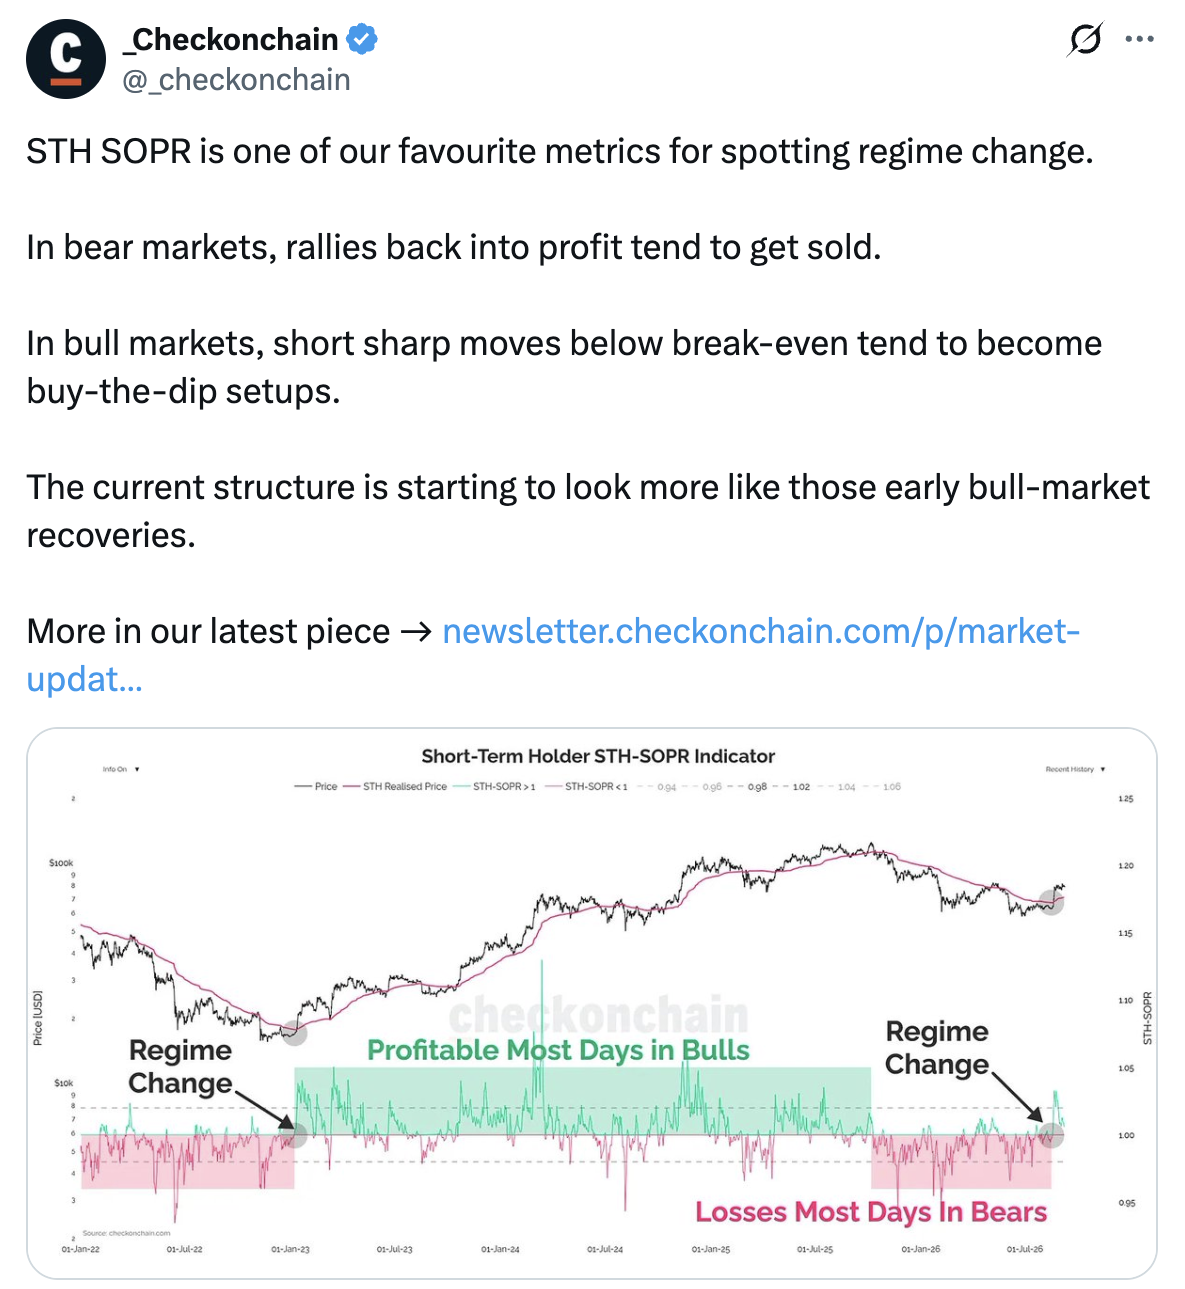
Bitcoin STH-SOPR data. Source: Checkonchain?
In a textbook bear market, any rally back toward the breakeven level is aggressively sold by trapped investors looking to exit. Conversely, in a true bull market, brief and sharp drops below breakeven are quickly absorbed as buy-the-dip opportunities.
The current structure mimics conditions seen in early stages of previous bull markets, where the SOPR rose and was sustained above 1. If the SOPR continues to rise, the BTC/USD pair could embark on a sustained rally, potentially pushing above the immediate resistance above the $82,000 level that currently suppresses the price.
1.18 Million BTC Creates a Major $82K–$86K Supply Wall
Despite these optimistic profitability metrics, the spot price faces immediate friction from a massive overhead supply wall.
According to the Glassnode cost basis distribution heatmap, the market is confronting a heavy concentration of supply between the $82,000 and $86,000 levels. Investors previously acquired a staggering 1.18 million BTC, within this specific price band.
As the BTC price climbs into this zone, many of these holders—who have sat through extended drawdowns—are highly likely to sell their positions just to break even, creating a natural ceiling that frustrates any attempts to push the price past this area.
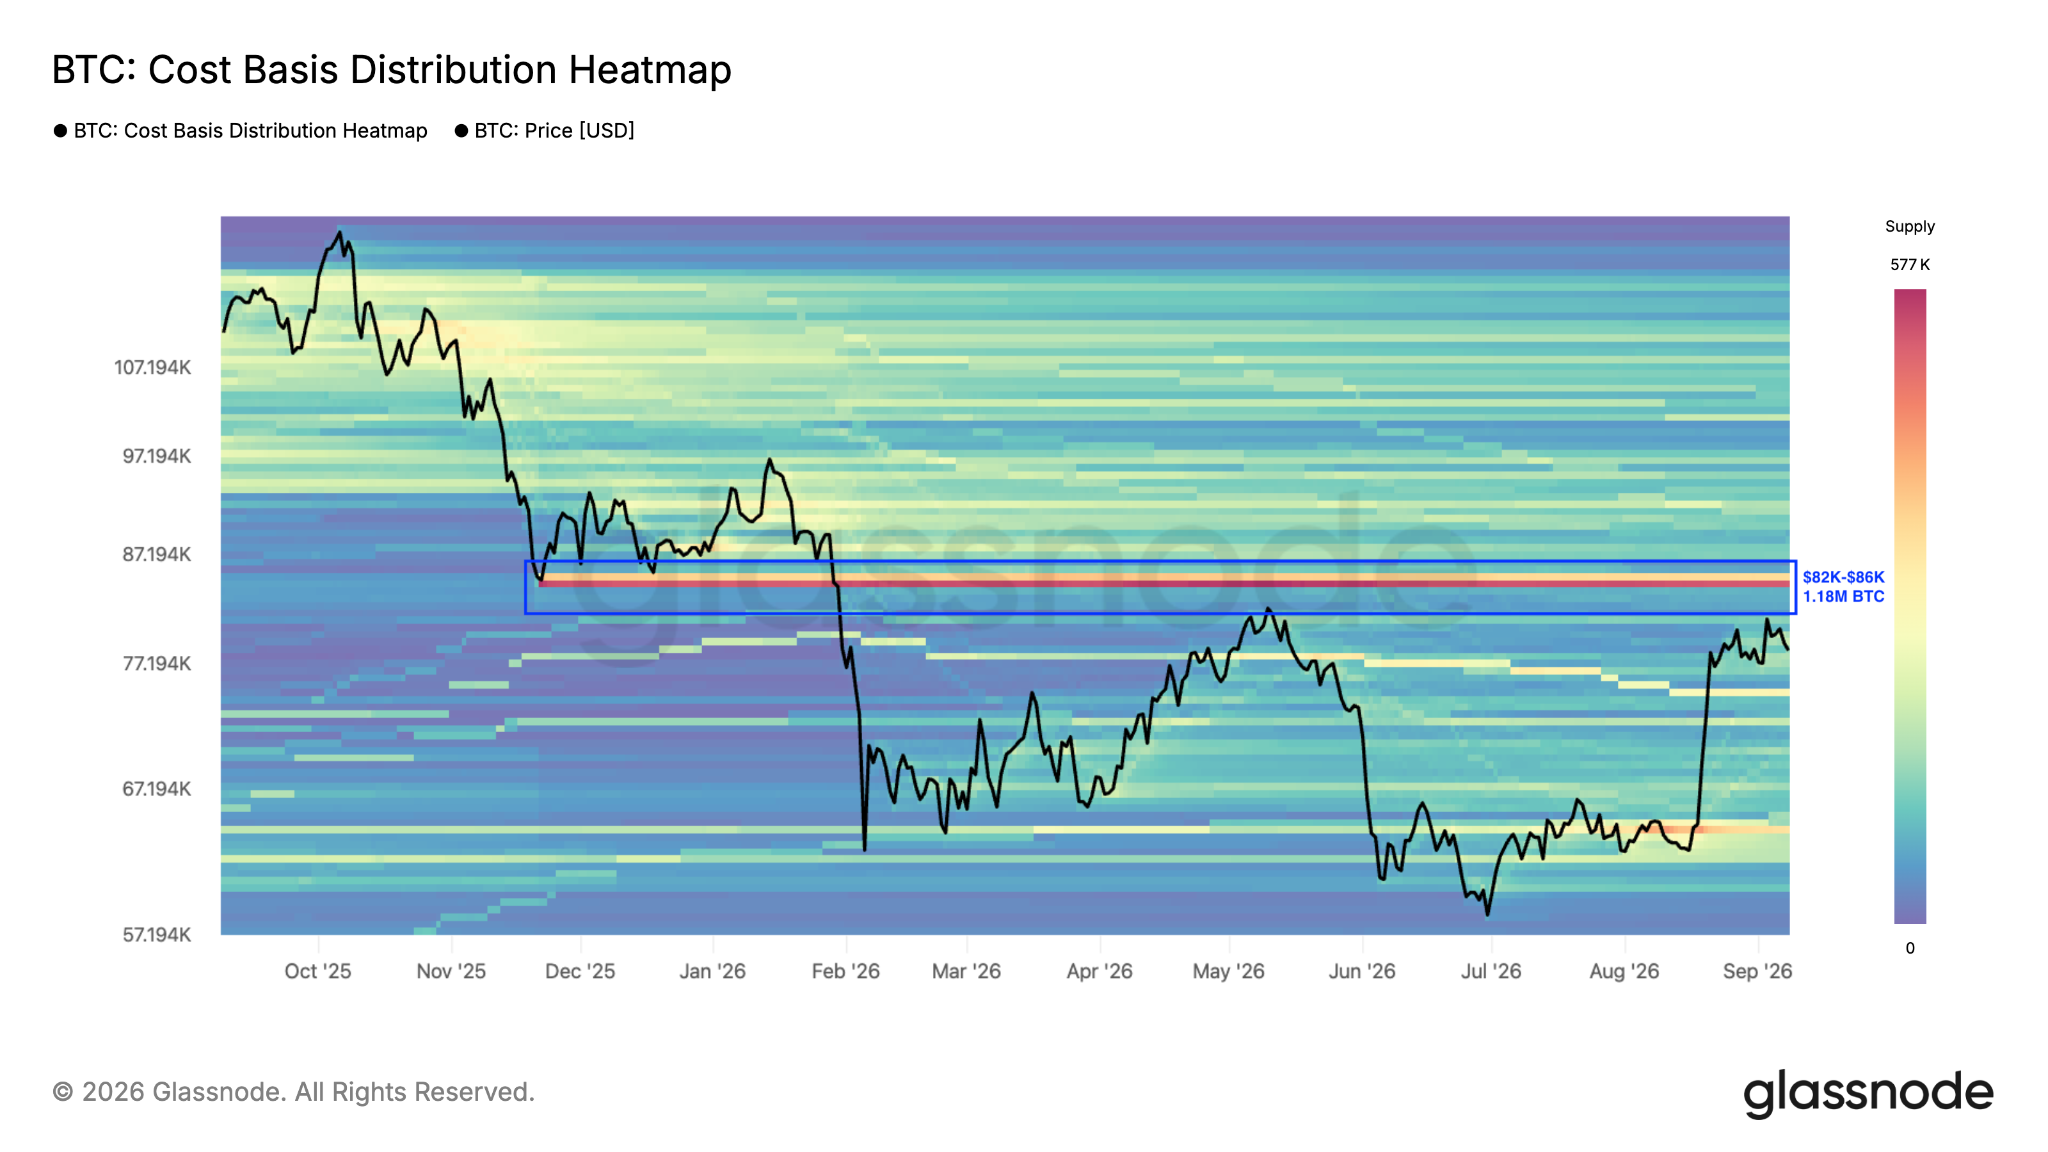
Bitcoin cost basis distribution chart. Source: Glassnode
This structural setup introduces prominent defensive risks. As DailyForex reported, a sharp rejection from this exact overhead resistance in May led to a devastating price collapse, sending Bitcoin 30% down toward its macro low near $57,000.
Because of this historical precedent, institutional analysts remain cautious. David Puell, creator of the Puell Multiple and a portfolio manager at ARK Invest, argues that downside risks are far from resolved.
In an interview with CryptoQuant on Sept. 4, Puell emphasized that more time and evidence are required to confirm that a macro bear-market floor has already been established.
Asked about how Bitcoin’s 25% August upside could play out going into Q4, Puell suggested that further upside was the less likely outcome.
“In our view, as of now, we leave it as a downside risk,” he said.
Puell added that for a definitive bullish trend reversal to be confirmed, the SOPR metric must sustain its position above 1 over an extended period, proving that the market can realize consistent profits without dragging the price back down to local cycle lows.
What Bitcoin Needs to Break Above $86K
The price is currently sitting on key support at $78,300, a level that must hold to prevent a total invalidation of the recent recovery structure. This support retest arrives amid broader macroeconomic headwinds, as escalating Middle East tensions have pushed US WTI crude oil to a three-month high near $95 per barrel, stoking renewed inflation fears and dragging down risk assets. A definitive reduction in geopolitical tensions is vital to stabilize volatile commodity markets. A cooldown would pull crude oil prices back down from recent multi-month highs, calming structural inflation fears and allowing global equity indices to stage a sustainable relief rally.
Market analysts are now shifting their focus to the upcoming Consumer Price Index (CPI) inflation gauge. If the data reveals cooling inflation, it will alleviate mounting market expectations of aggressive central bank tightening, effectively reviving broader appetite for risk assets. Conversely, sticky numbers will keep risk premiums elevated, anchoring global liquidity away from the crypto markets.
Finally, a structural return to positive spot Bitcoin ETF flows would also bring institutional demand that could likely push BTC price higher. Sustained institutional inflows via aggregate ETF buying are essential to absorb the heavy sell-side liquidity waiting at $86,000. Without this coordinated influx of external institutional capital and a macro risk-on shift, the overhead wall will continue to dictate short-term price action.
The coming sessions should reveal whether this pause below resistance is a temporary consolidation before a major breakout, or a sign of a deeper, macro-driven correction.
Ready to trade our analysis of Bitcoin? Here’s our list of the best MT4 crypto brokers worth checking out.