


King Crypto’s latest recovery has brought the market back to a level that could determine whether the latest rebound develops into something more durable. Yet the price is facing a familiar problem: while demand has improved, supply remains concentrated above the spot price.
Top Regulated Brokers
That creates an unusual tension. Bitcoin is no longer trading within the $60,000-$65,000 range that defined its price action for the better part of the summer, with the daily structure improving considerably.
Meanwhile, each attempt to push deeper into the low-$80,000s has met holders with an incentive to reduce exposure. The result is a market that appears constructive on shorter time frames while remaining constrained by a broader range.
The question, therefore, is less about whether Bitcoin can break above $82,000 and more about whether buyers can absorb potential selling pressure from suppliers above this level to establish that area as support.
Bitcoin Price Runs into Supply Overhang
Bitcoin pushed above $82,000 on Sept. 2 as the recovery from the summer consolidation extended higher. While the move marked BTC’s strongest daily close since May 10, the advance encountered steady supply and subsequently turned lower toward the $79,000 area on Monday.
Glassnode described the move as a relief rally following the mid-August short squeeze that stalled beneath long-term overhead supply.
The futures liquidation heatmap demonstrates the bilateral structure bracketing price.
“While the upward impulse consumed short orders in its path, it stopped short of the dense cluster of short liquidations situated between $83K and $86K,” the onchain data provider said in its latest Week On-chain report.
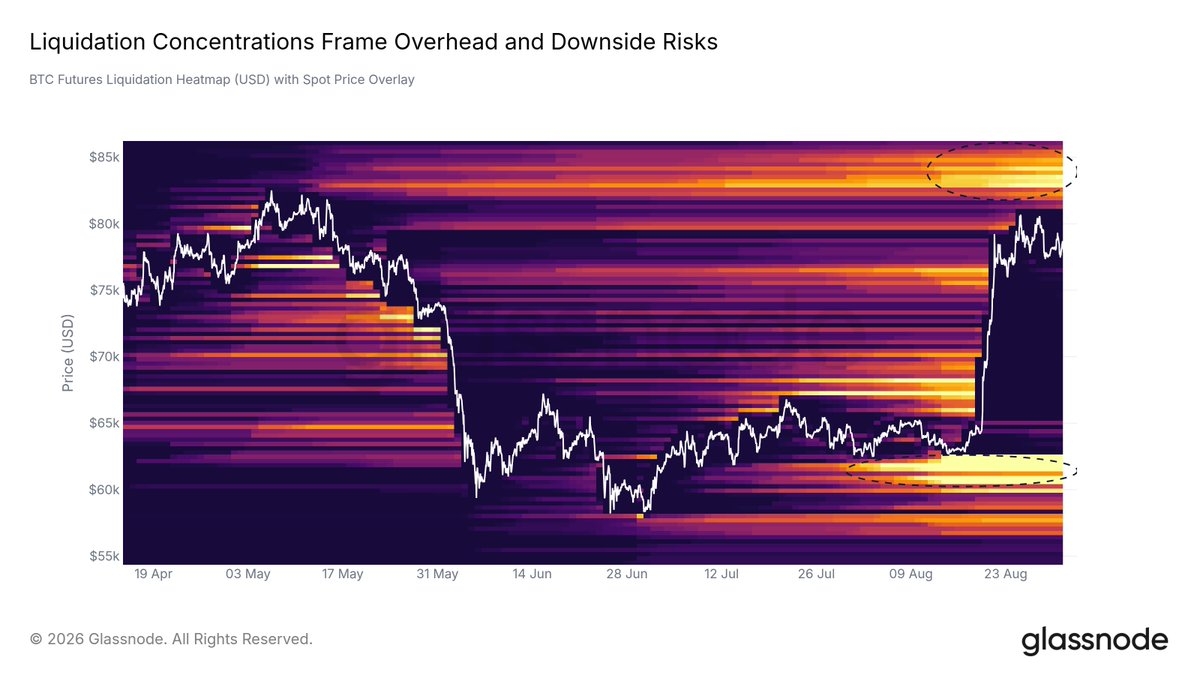
Bitcoin futures liquidation heatmap. Source: Glassnode
Glassnode’s profitability data adds another layer to this narrative.
“When Bitcoin traded near $78K in May, roughly 65% of supply was held in profit,” the market intelligence firm said.
Note that when the BTc/USD pair returned to similar levels in late August, the “share of supply in profit climbed to 68%,” Glassnode added.
At the time of writing on Monday, the percentage supply in profits is at 70.8%, levels last seen in January 2026. This increase in profitability comes after Bitcoin’s latest rise above $80,000.
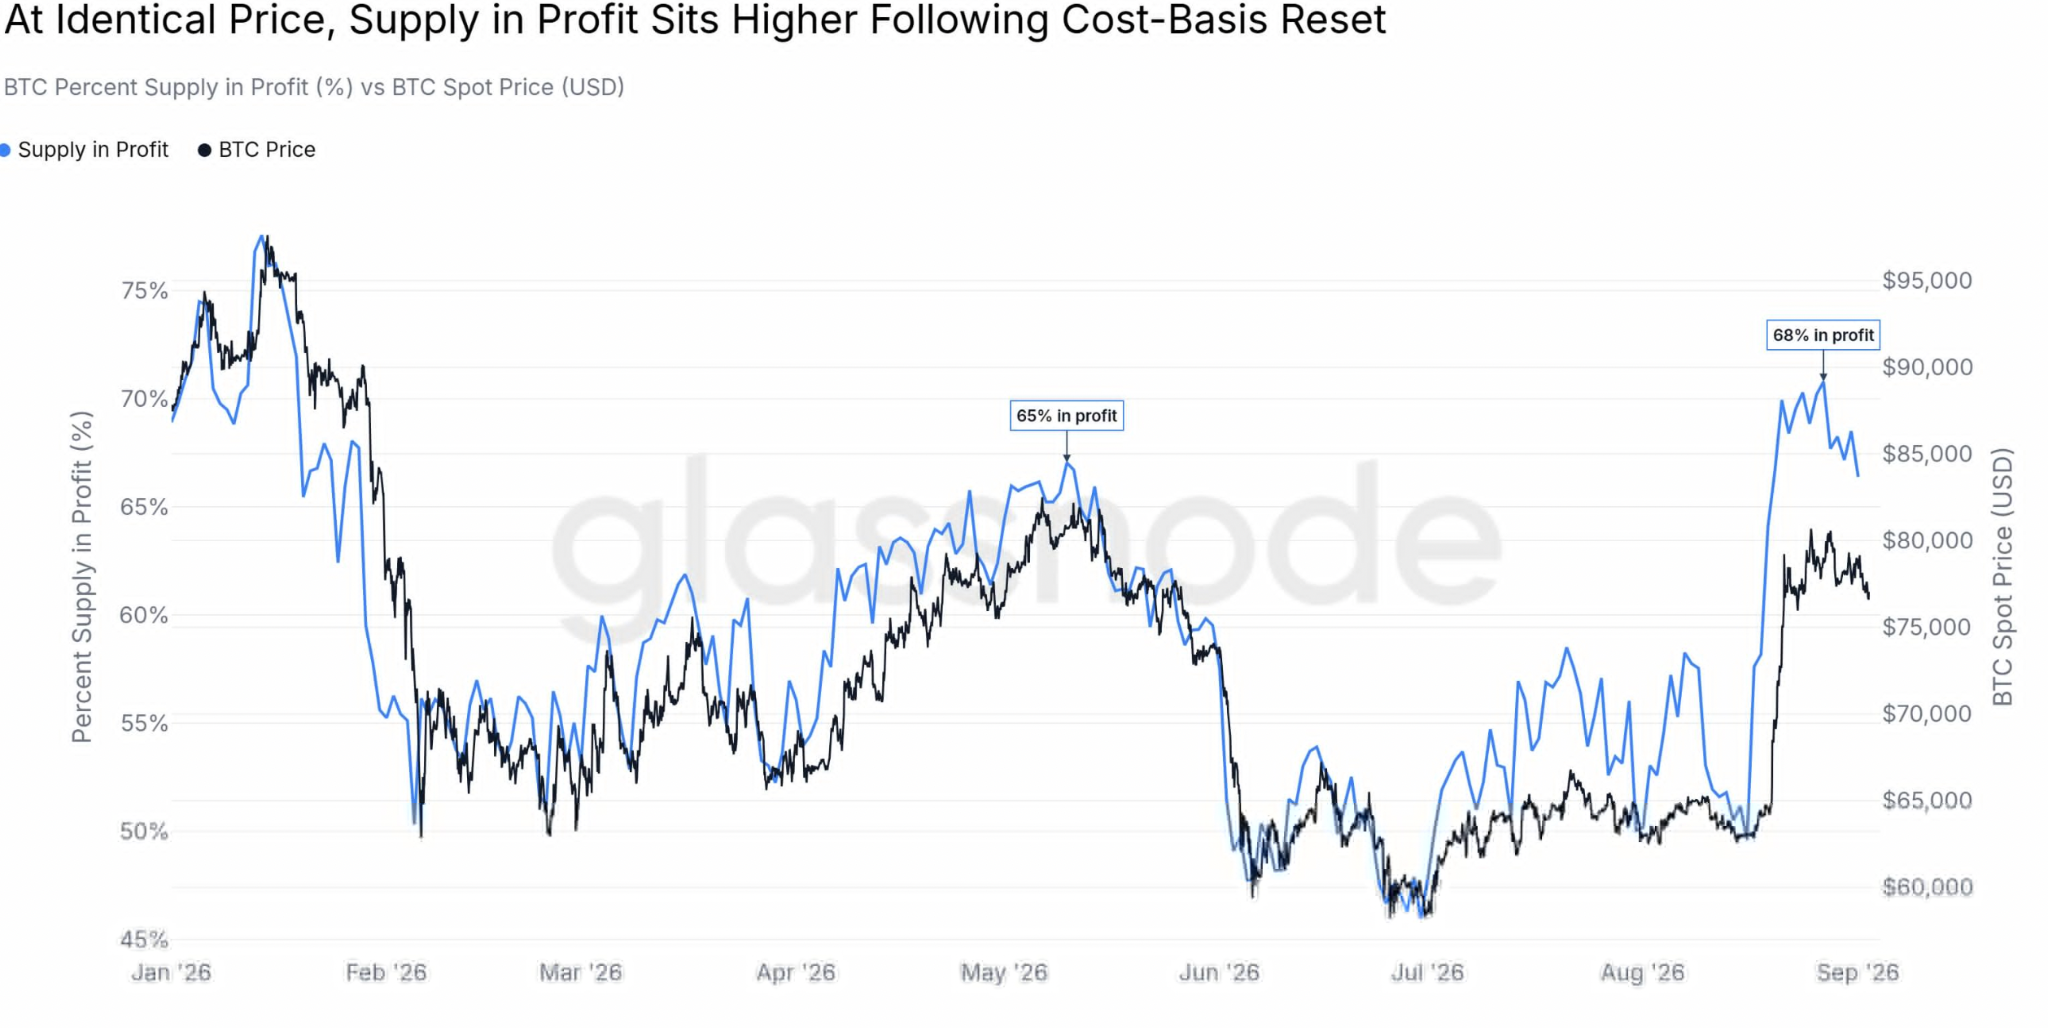
Bitcoin supply in profit: Source: Glassnode
Glassnode also attributes the change to summer redistribution, which pushed the short-term holder cost basis toward $71,000 and left a larger pool of profitable coins potentially available for sale as price approaches previous highs.
That does not mean 71% of BTC supply will suddenly be sold. Rather, it increases the amount of potential sell-side liquidity that fresh demand must absorb. The effect can be especially noticeable after a leveraged rally, when traders who bought into the move begin protecting gains and long positions are liquidated as momentum fades.
Such levels of profitability “activate a larger volume of profitable coins, creating an expanded pool of latent sell-side liquidity when spot tests prior highs,” Glassnode concluded.
Therefore, Bitcoin’s stop below long-term overhead supply and that cost-basis bands and liquidation clusters show strong confluence. This helps explain why the $82,000 level remains a formidable resistance level.
Bitcoin Remains Trapped Between Two Key Levels
Bitcoin has failed to break above $80,000 as its rebound stopped short of a bull market comeback.
Bitcoin’s price is currently consolidating between the firm accumulation floor between $62,000 and $65,000 and the overhead resistance formed by the market confronts heavy Long-Term Holder supply between $82,000 and $86,000. Spot remains contained between these two zones.
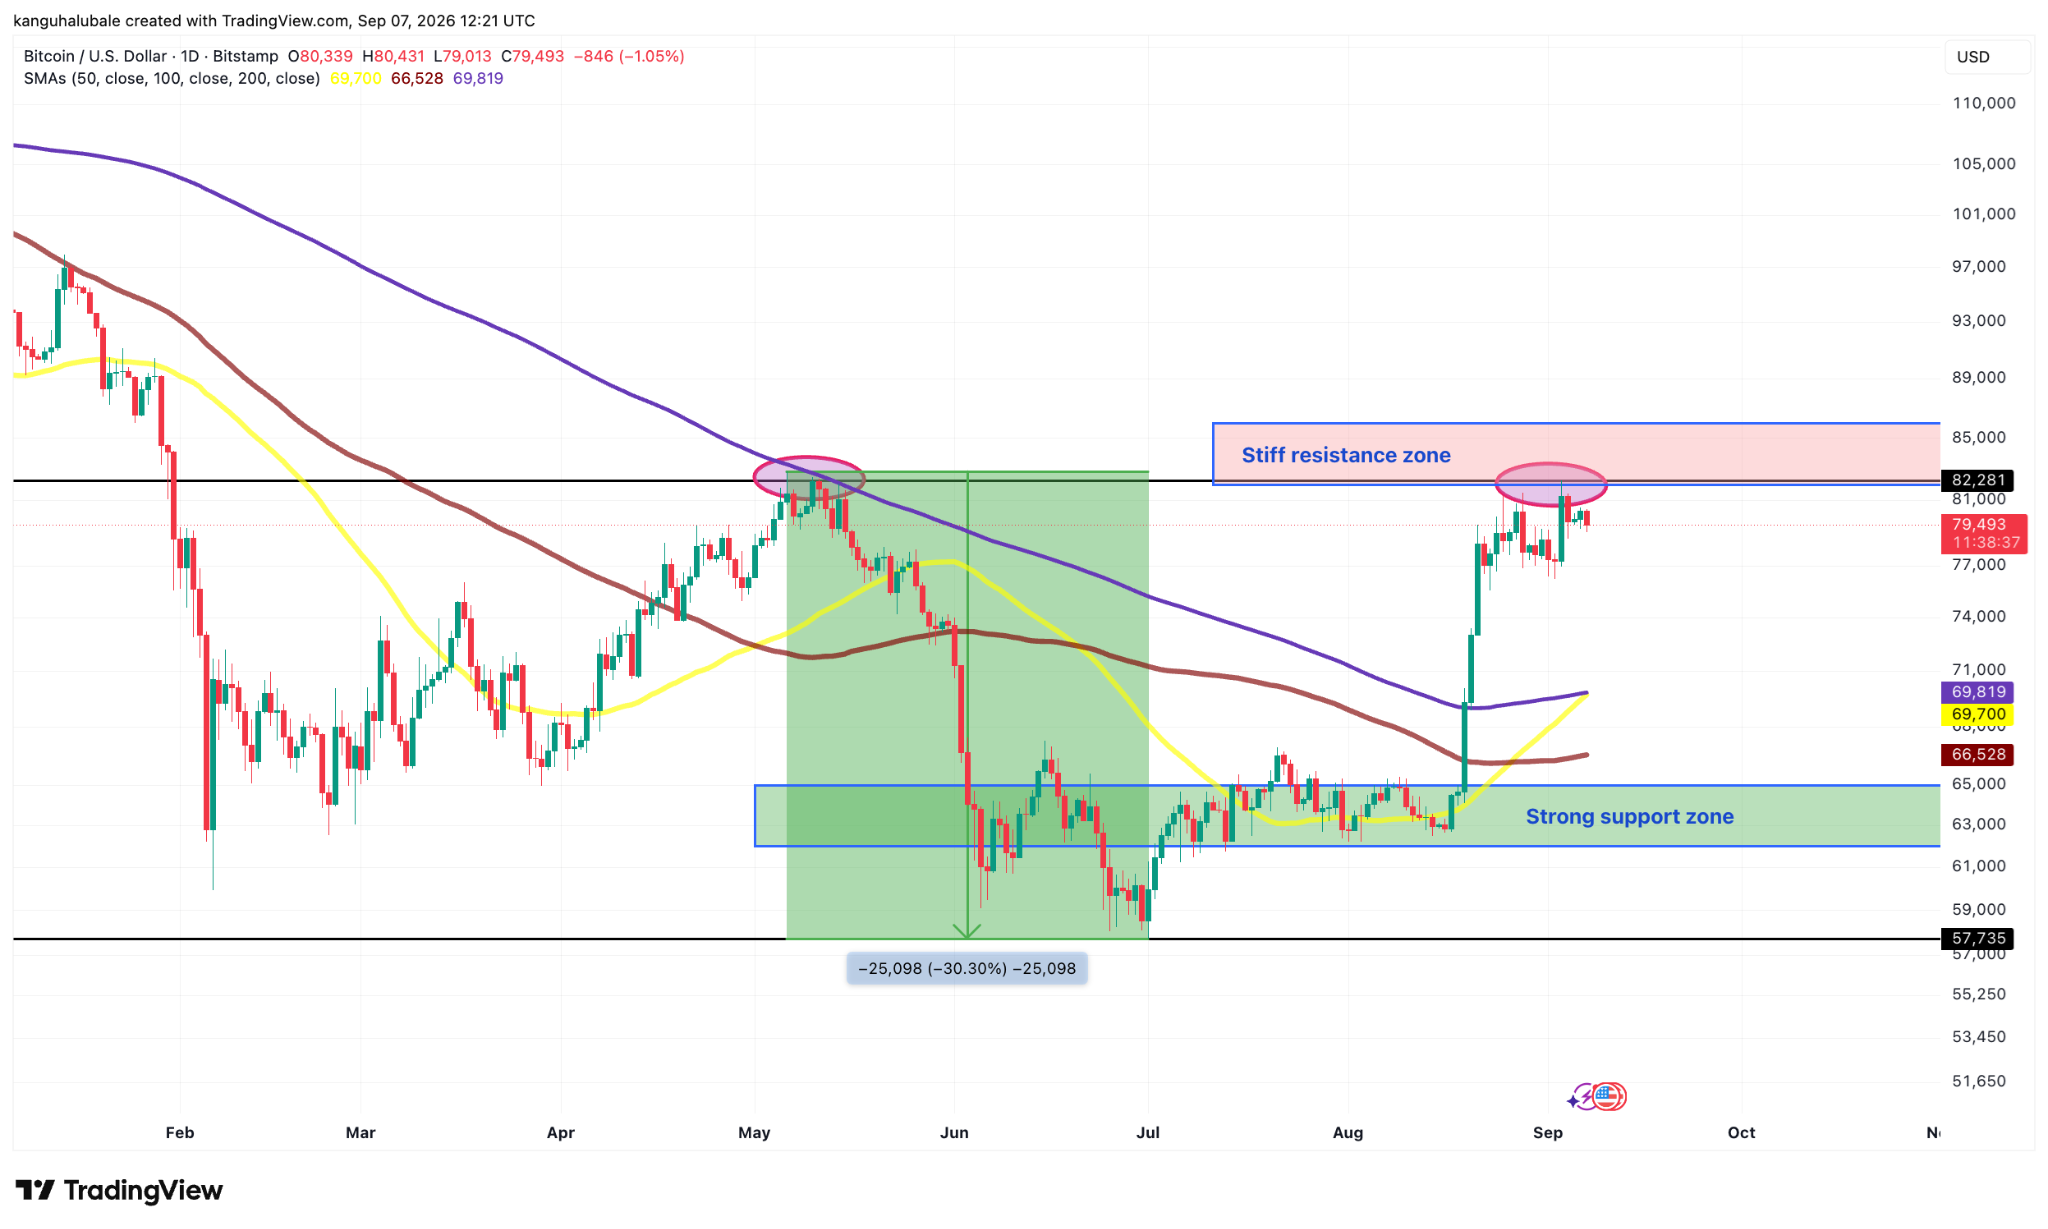
BTC/USD daily chart. Source: TradingView
The chart above shows that the last time the BTC/USD pair was rejected from this level was in early May, preceding a 30% drop to the macro level at $57,700 reached on July 31.
That historical reaction matters because it shows how quickly a failed breakout can change market psychology. A similar rejection may not produce another 30% decline to suppress bullish sentiment. Even a moderate pullback can encourage profit-taking, trigger leveraged liquidations and convince sidelined buyers to wait for lower prices.
“Bitcoin is still in the downtrend that started from the 2025 high,” analyst said in an X post on Monday, adding:
“$83K is now the key level to break. Until that happens, the breakout is not confirmed.”
Sharing similar sentiments, MN Capital founder Michael van de Poppe argues that Bitcoin may break higher after sweeping liquidity below recent lows, targeting $82,700. The analyst also points out that the range could resolve upward if buyers flip the resistance at $82,000 into support.
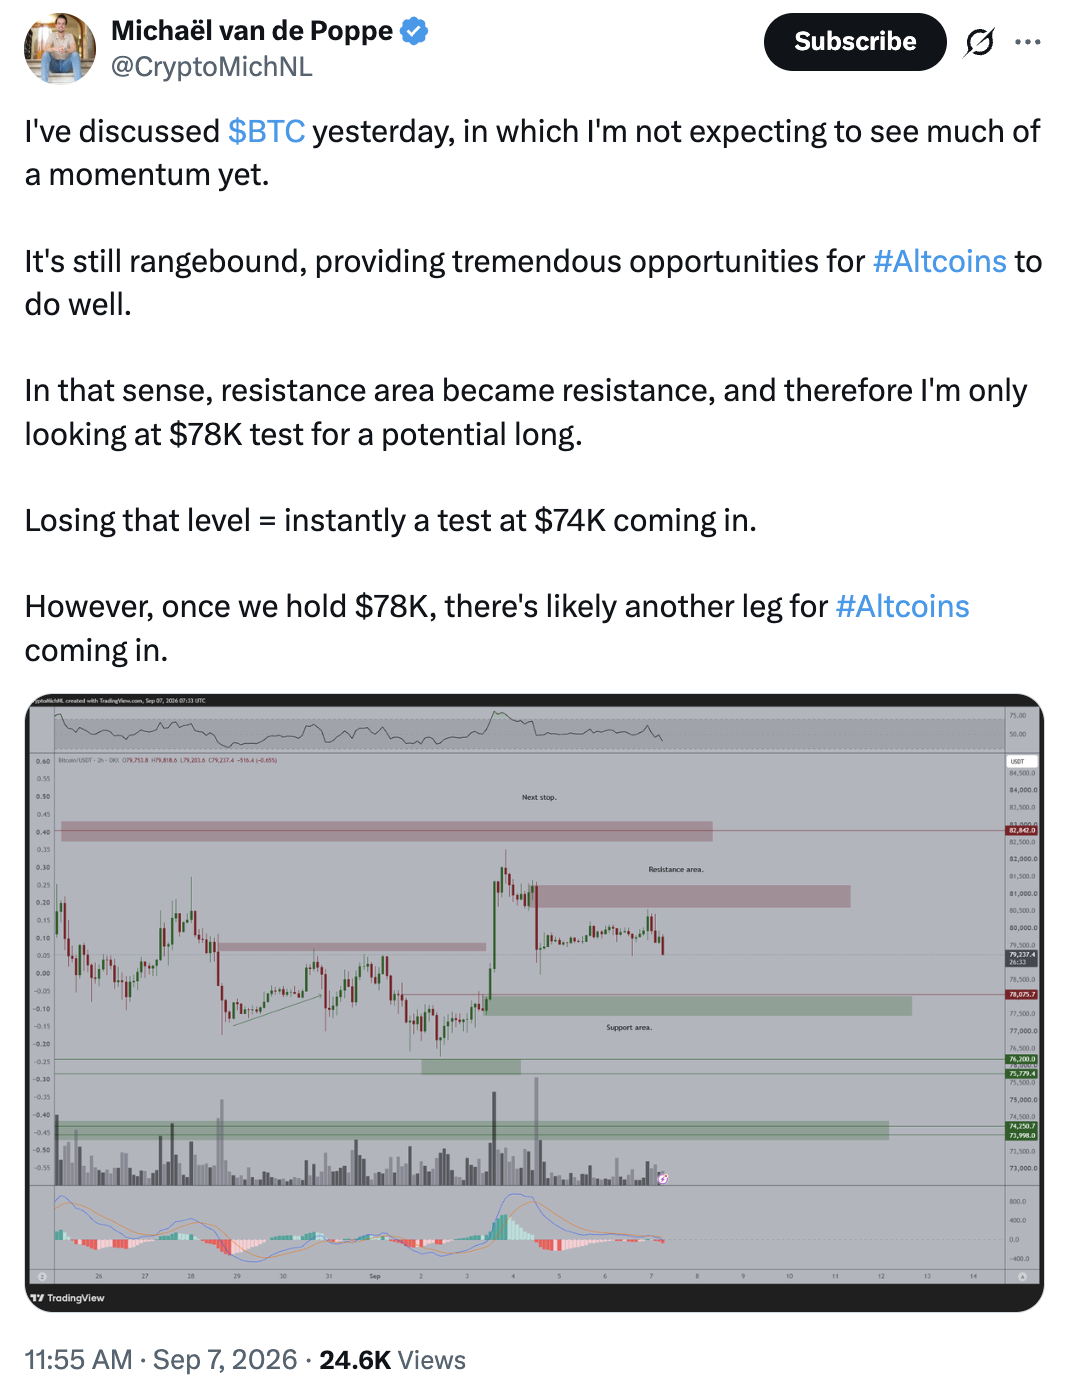
BTC/USD 2-hour chart. Source: Michael van de Poppe/X
The TradingView chart above also shows Bitcoin remains well above its 50-, 100- and 200-day simple moving averages, suggesting that the recovery has strengthened the short-term structure even as price remains below major overhead supply.
Bitcoin is consequently operating between two structurally important zones. The lower band has attracted accumulation and provides a reference for buyers during weakness. The upper band contains older supply that can become available as holders approach breakeven or profit-taking levels. Until one side of this range gives way decisively, BTC price can continue oscillating between demand and distribution.
Together, the technical and on-chain signals suggest that a near-term push above $82,000 may require substantially more spot demand than the late-August rebound generated. If this happens, it could signal a trend change and possibly the beginning of the next bull market.
H2 Why Supply Overhang Timing Matters in a Fed-Pause Cycle
Bitcoin's supply overhang at $82,000 arrives at a critical juncture: with Federal Reserve rate expectations stabilizing in the 4.25%–4.50% range, institutional capital is re-evaluating risk asset allocation. As monetary tightening bias softens, the narrative shifts from 'when will rates drop?' to 'can capital absorb new supply?' This timing explains why profitability metrics matter now. Long-term holders accumulated during the panic phase (June–August) when Fed rate policy was perceived as terminal. Now, as uncertainty about rate cuts moderates, those profitable positions face a divergence: hold for further upside, or crystallize gains into a recovery that may stall at the very resistance level where May's breakout failed. The $82,000 bottleneck is not just a technical artifact; it reflects institutional hesitation about whether fresh capital can absorb profitable long-term holder selling in a regime where risk appetite remains cautious.
H2 The Consensus Blind Spot: Why Range-Bound May Mask Downside Risk
Market consensus currently frames Bitcoin's dynamics as a range-bound consolidation: accumulate near $79,000–$80,000, sell resistance near $82,000–$84,000, repeat. This framing suggests complacency about a specific vulnerability: 70.8% profitability does not guarantee orderly profit-taking. History indicates that when profitable supply reaches this concentration, a sudden deterioration in buyer conviction can trigger cascade liquidations faster than the slow grind of range trading. A failed breakout at $82,000 would not simply retreat to $80,000; it could invite aggressive shorting and forced liquidations of leveraged long positions, potentially accelerating a move to $75,000 or lower in 24–48 hours. The consensus blind spot is that the market treats $82,000 as a technical resistance to be tested methodically, when on-chain data suggests it may act as a pressure release valve where profitable supply floods the market if institutional buyers hesitate even briefly.
H2 Invalidation Parameters: Drawing Clear Thesis Boundaries
The analytical framework presented here remains valid only under specific conditions. A decisive daily close above $84,500 on spot Bitcoin would invalidate the range-bound, supply-constrained thesis and confirm that institutional buyers have absorbed long-term holder selling and are building positions for a sustained breakout. This would shift bias decisively to the upside and target higher resistance levels near $90,000–$95,000. Conversely, a drop below $75,000 would signal that long-term holder accumulation in the $60,000–$65,000 range lacked sufficient follow-through demand and would shift market structure downward toward the $62,000–$65,000 support band. Between these two invalidation points, the analysis holds: Bitcoin consolidates in the $79,000–$83,000 friction zone, with supply and demand locked in equilibrium. Any macro event that violently shifts risk appetite—geopolitical escalation, unexpected Fed policy shift, or corporate capital flow reversal—would override this technical framework.
Bitcoin consolidates in a structural friction zone where profitable long-term holder supply challenges fresh institutional demand at the $82,000–$84,500 resistance band. On-chain profitability data now indicates 70.8% of circulating supply sits in profit, the highest concentration since early 2026—a level that masks vulnerability to sudden capitulation if buyer commitment falters. The near-term thesis remains range-bound, but the analysis deliberately leaves one critical unresolved question: whether institutional capital will absorb this profitable supply or whether supply pressure will force a sharper retreat, a divergence that will clarify within 48 to 72 hours of price action.
Ready to trade our analysis of Bitcoin? Here’s our list of the best MT4 crypto brokers worth reviewing.