


King Crypto has shifted from defending lower support to testing levels that could reopen the path toward six-figure prices. The recovery has been notable because it has developed despite a challenging macro backdrop and after the recent failure of the CLARITY Act in the US Senate.
Top Regulated Brokers
The latest rally has also been accompanied by stronger institutional demand, improving onchain conditions and a broad technical recovery. Together, these factors are providing Bitcoin bulls with a stronger foundation than the market had during the August-September consolidation.
Bitcoin climbed to an eight-month high of $87,395 on Tuesday, its highest level since late January, before retracting to $85,892 at the time of writing. The move represented a more than 30% recovery from the Aug. 19 low, according to data from TradingView and CoinMarketCap.
Against this backdrop, several onchain and technical metrics suggest that Bitcoin’s upside is not over.
ETF Inflows Point to Renewed Institutional Demand
Bitcoin’s recovery was fueled by high investor appetite for US-based spot Bitcoin exchange-traded funds (ETFs), which recorded $1.7 billion net inflows over the last two days, according to SoSoValue data. Total ETF assets had climbed to roughly $111 billion.
These investment products saw $714 million in net inflows on Tuesday, with BlackRock's IBIT accounting for about $381 million of the inflow. Meanwhile, Fidelity's FBTC came in second with inflows totaling $257 million on the same day.
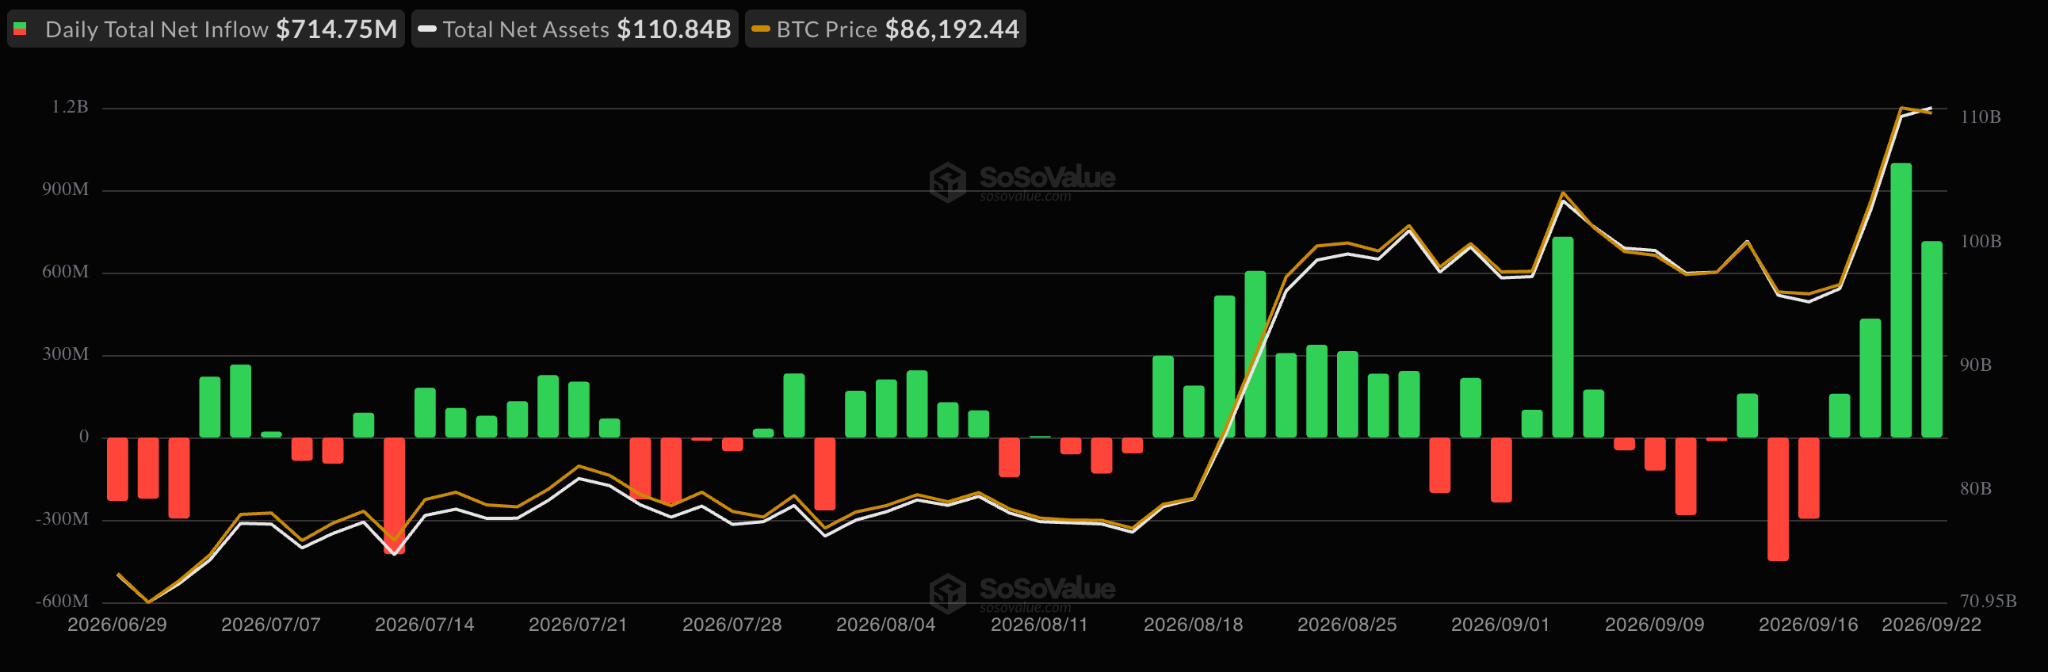
Spot Bitcoin ETF flows chart. Source: SoSoValue
“Bitcoin ETF demand just hit an extreme. There were $937.3M in net inflows on September 21, the largest single-day inflow since Bitcoin’s October 2025 all-time-high,” onchain data provider Santiment said in a Tuesday post on X, adding:
“ETF investors are chasing strength again as $BTC trades near eight-month highs.”
The Kobeissi Letter highlighted the $999 million inflow on Monday was also “the 9th largest daily inflow since Bitcoin ETFs began trading in January 2024,” adding:
“Appetite for crypto is surging.”
The importance of these flows extends beyond the headline numbers. There is evidence of a positive relationship between Bitcoin ETF flows and BTC returns, although the relationship is not perfectly one-directional. A 2026 study estimated that each $100 million of net ETF inflows was associated with a 53-basis-point same-day Bitcoin return during its sample period.
Historically, periods of strong ETF demand have accompanied major Bitcoin rallies. For instance, after the launch of the US-based spot Bitcoin ETFs in January 2024, these investment products saw net inflows of approximately $8.5 billion between Feb. 13, 2024, and March 13, 2024, peaking at a record single-day inflow of $1.045 billion on March 12, 2024. This preceded a 73% rally in BTC price over the same period to its previous all-time highs of $73,800 reached on March 14, 2024.
Similarly, between Nov. 6, 202, and Dec. 16, 2024, cumulative daily inflows hit $5.7 billion, aligning with Bitcoin’s 60% rally from $67,000 to $108,000 over the same period.
These cases support the idea that high inflows into spot ETFs signal strong institutional demand, as has been seen over the past few weeks. If the trend continues, Bitcoin is likely to continue its uptrend toward areas above $100,000.
Long-term Signals Suggest a Changing Market Structure
Bitcoin's technical structure has improved considerably as the BTC/USD reclaims several key long-term support levels. The move above the 200-day moving average, 50-week SMA and 365-day moving average has shifted the market away from the deeply corrective structure seen earlier this year.
“Holding above them is what maintains a long-term uptrend,” Glassnode said in a post accompanying a chart showing this macro technical shift.
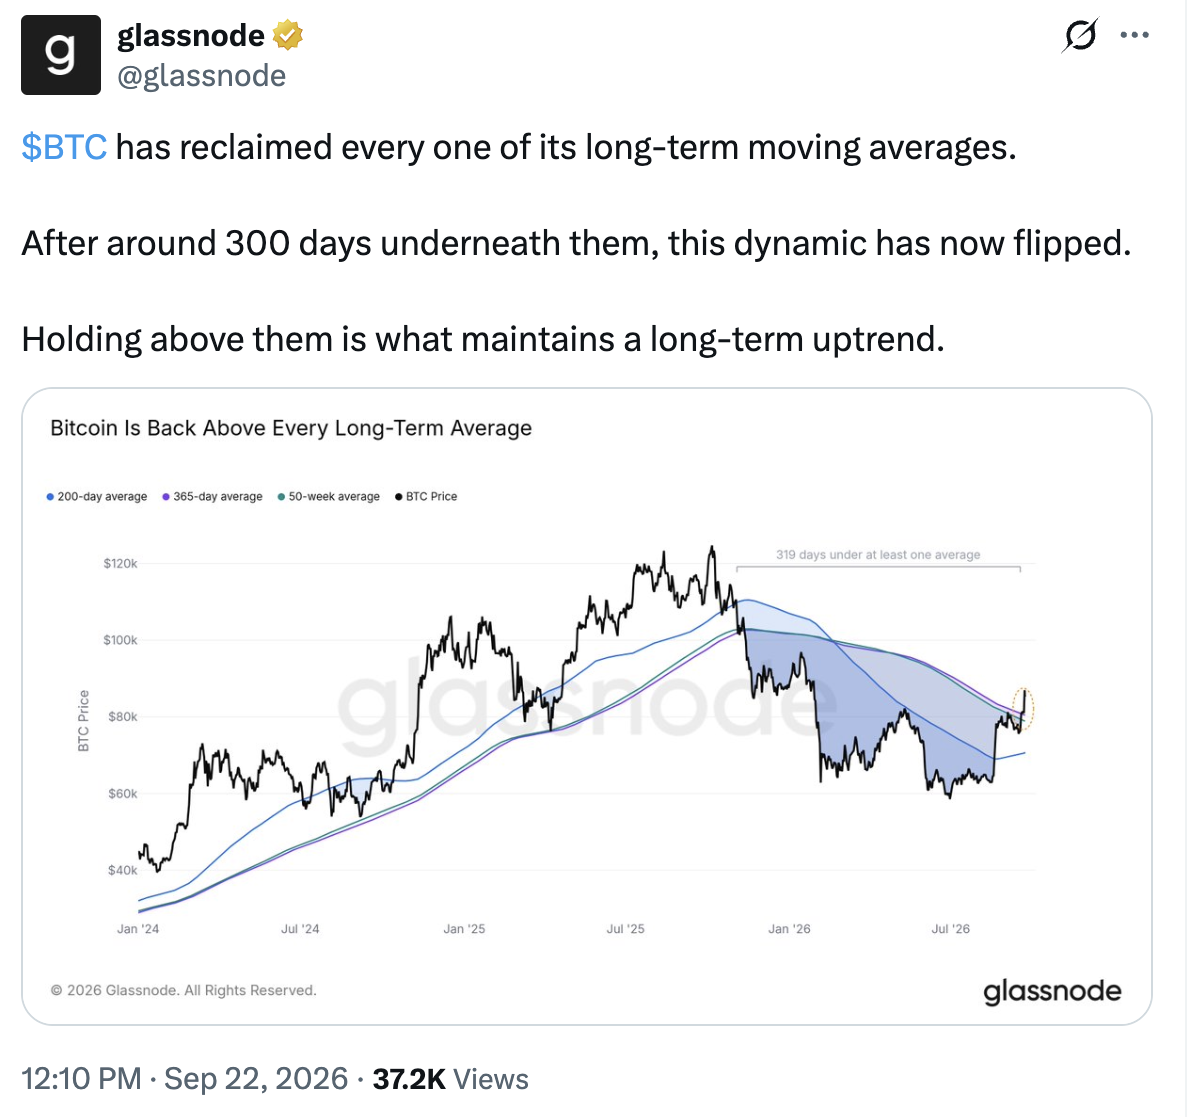
BTC/USD is back above long-term moving averages. Source: Glassnode
At the time of writing, Bitcoin trading around $84,633, above the 50-week SMA at $78,181. The 100-week and 200-week averages are positioned near $89,589 and $65,837, respectively, giving bulls a substantially stronger trend structure than during the first half of 2026.
Glassnode also highlighted the improvement in Bitcoin's onchain momentum, with its Market Value Realized Value (MVRV) ratio has crossed back above its 365-day moving average, “same cross that we saw in 2019 and 2023 at the beginning of each bull market.”
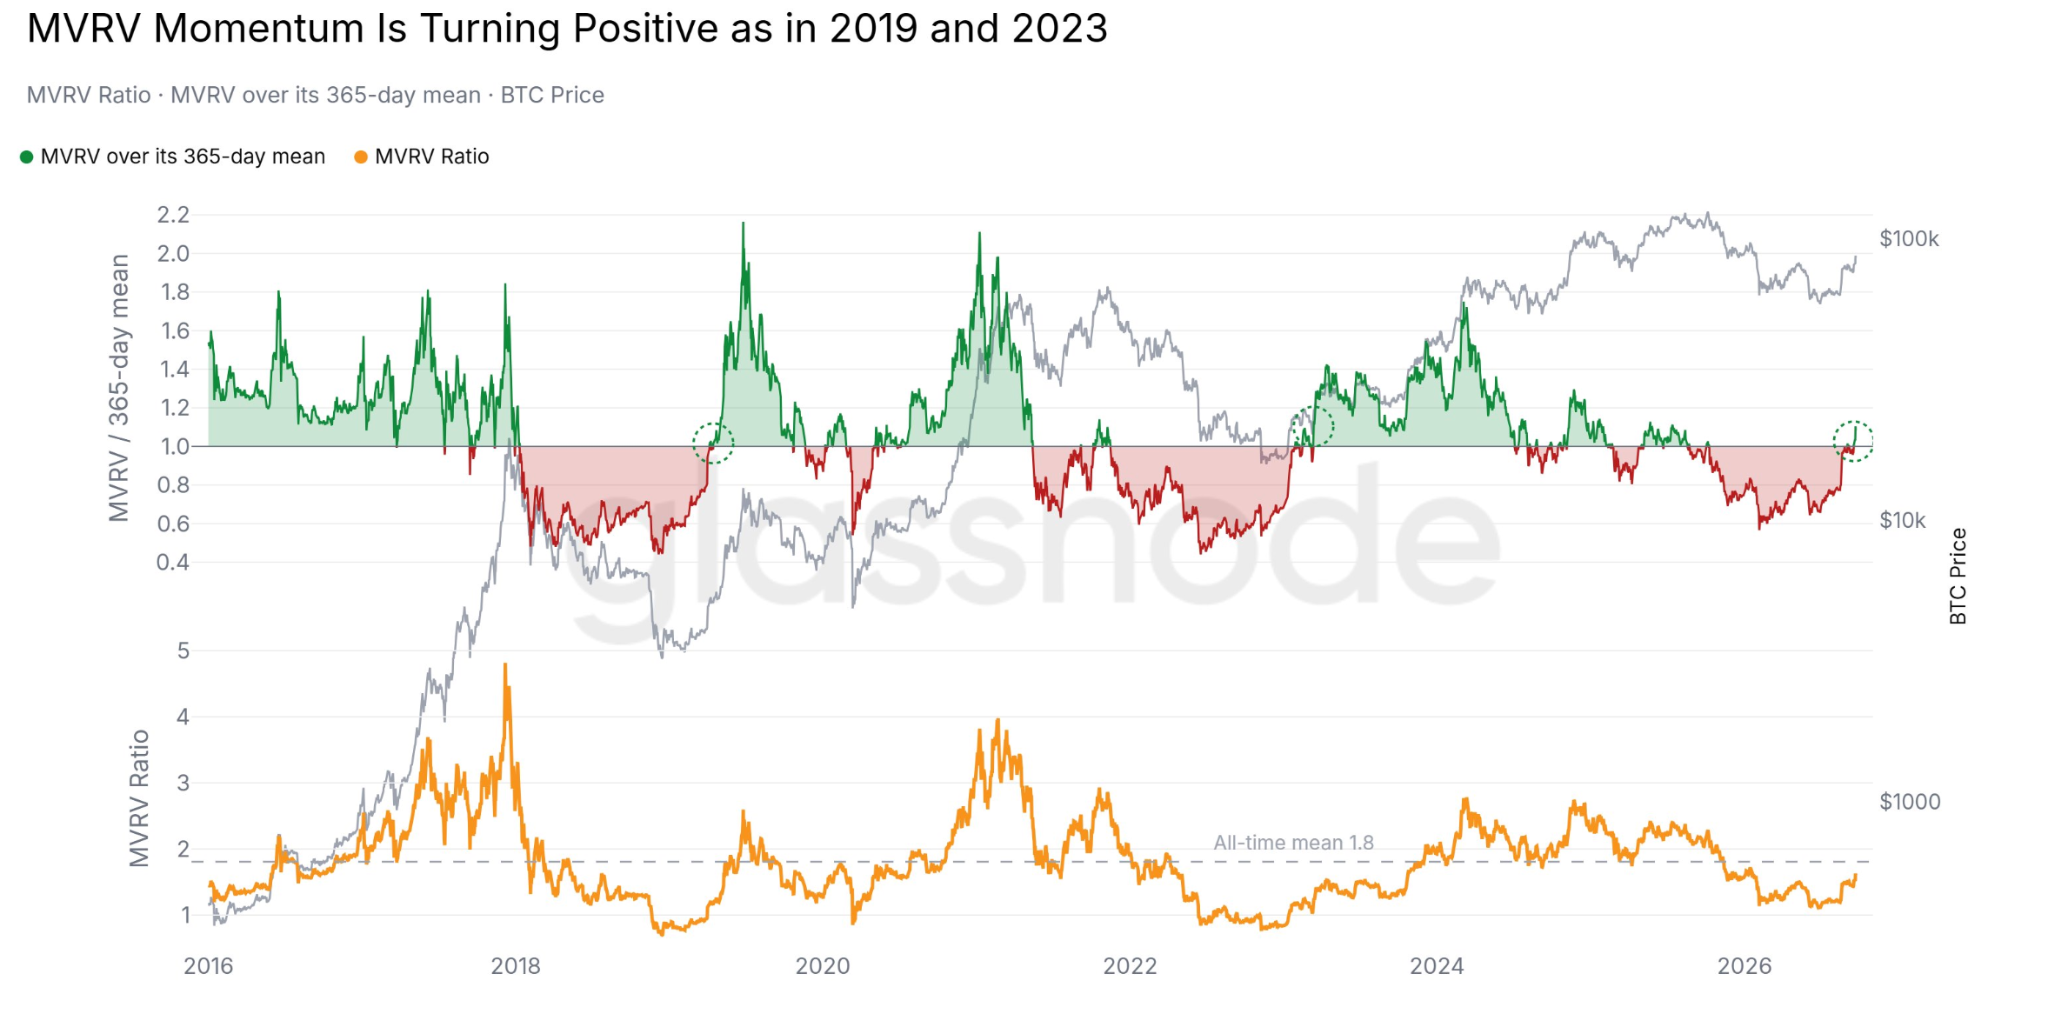
Bitcoin’s MVRV ratio turns positive for the first time since 2023. Source: Glasssnode
MVRV compares Bitcoin's market value with its realized value, providing a measure of aggregate investor profitability. When MVRV moves above its annual trend, it indicates that the market's profitability is recovering relative to its longer-term baseline.
Note that after the same crossover appeared in 2019 and 2023, Bitcoin went on to rally 815% and 355%, respectively.
The combination of rising MVRV momentum and reclaimed moving averages strengthens the argument that BTC has moved into a different market phase. Scott Melker has similarly pointed to the weekly 50-day/50-week structure as confirmation of a potential transition away from the bear-market phase.
If BTC can maintain these reclaimed averages during any short-term pullback, the technical structure would remain constructive and could leave the $100,000 psychological level within reach.
Exchange Outflows Reduce Readily Available Bitcoin Supply
Also backing Bitcoin’s bullish thesis is movement in and out of exchanges. CryptoQuant's exchange-flow metric tracks BTC moving into and out of exchange wallets, with exchange balances representing one of the more direct measures of immediately available sell-side supply.
The latest decline in exchange balances and negative netflow readings suggest that more Bitcoin is moving away from centralized trading platforms.
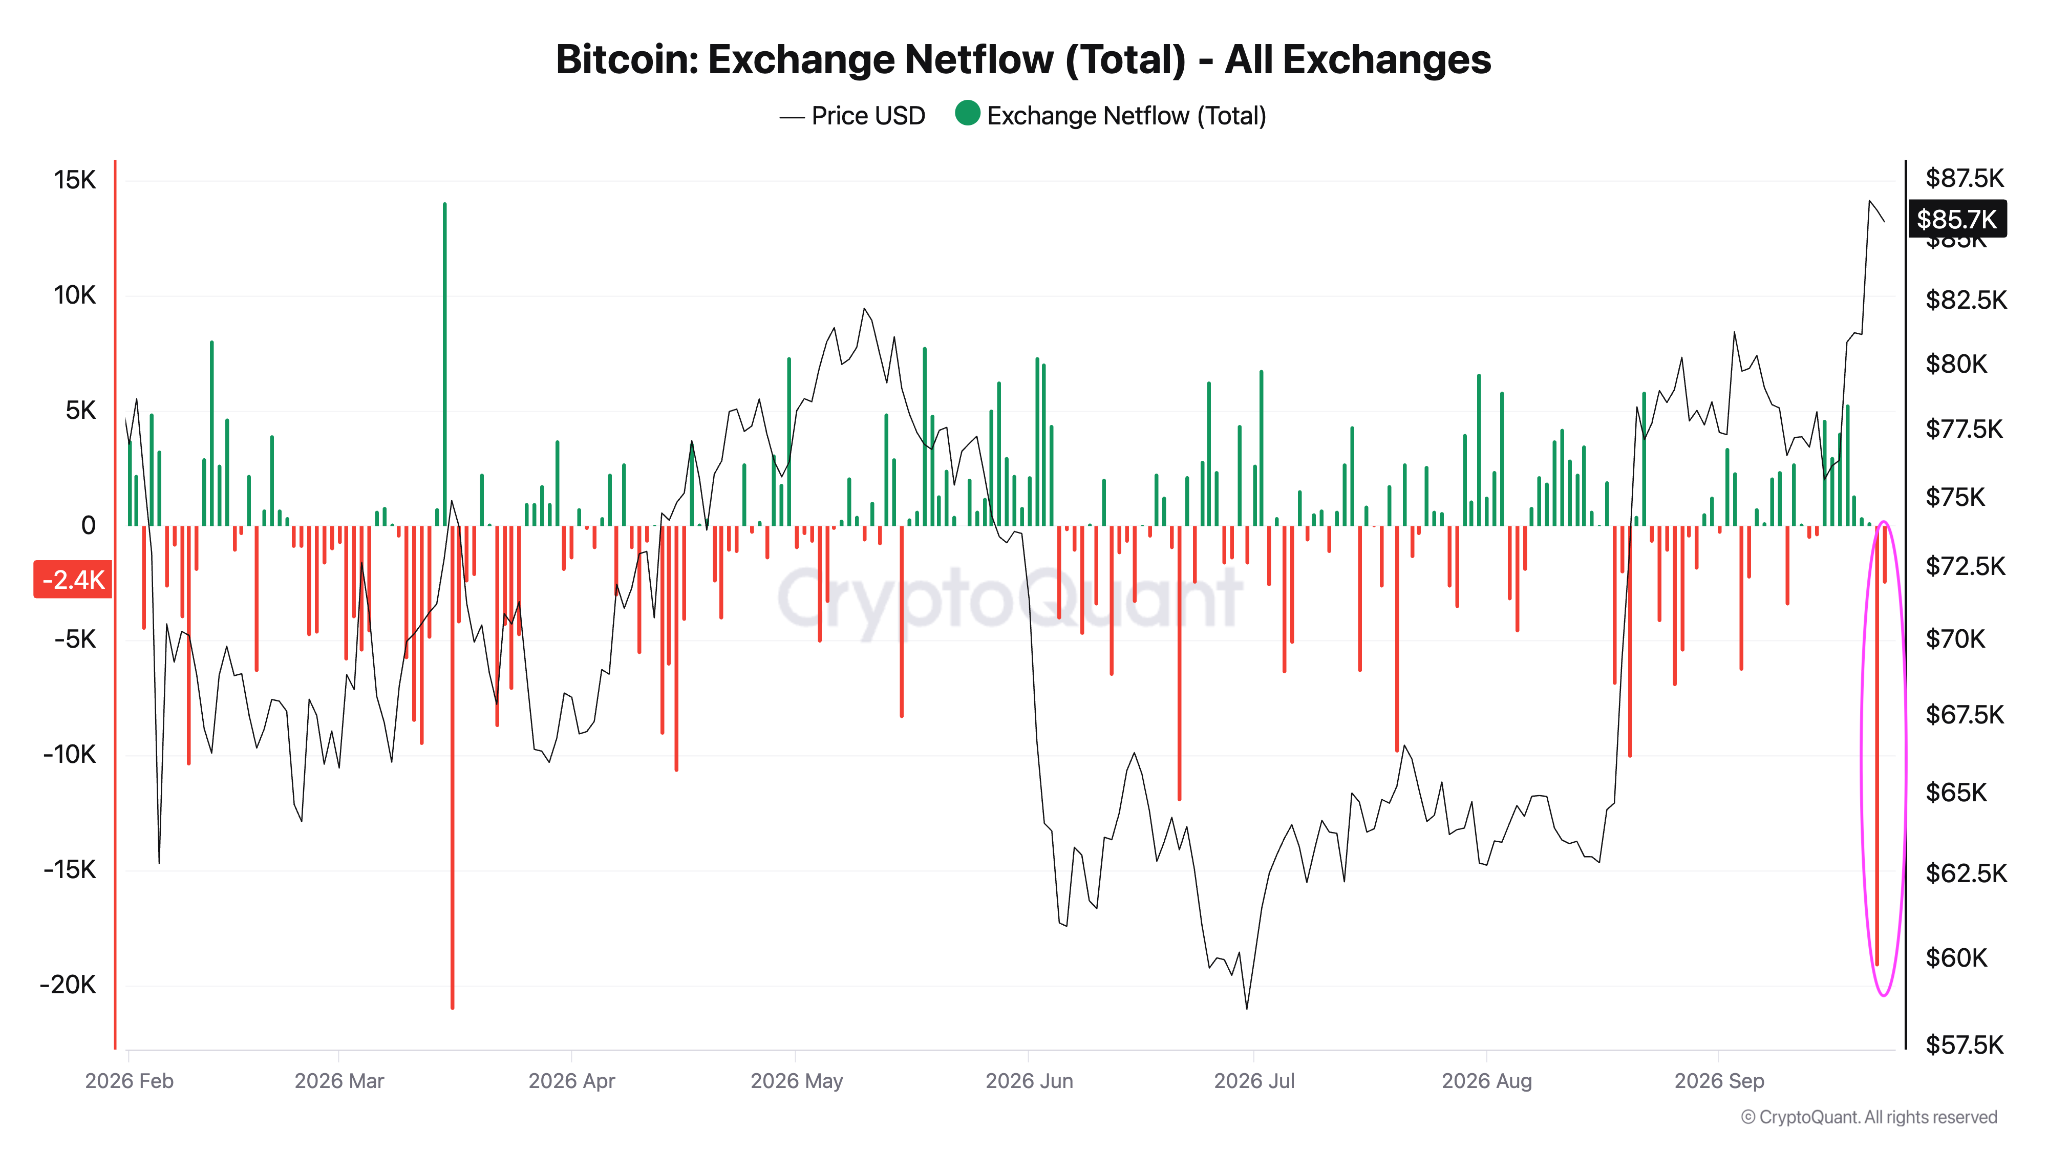
Bitcoin exchange netflow. Source: CryptoQuant
Cryptoquant data shows that “Binance’s Bitcoin netflow fell to around -$1.1 billion, marking the deepest negative reading on chart since September 2024.”
As such, declining exchange supply alongside rising ETF demand creates a potentially supportive supply-demand combination. If institutional demand continues while fewer coins are readily available on exchanges, relatively modest additional buying pressure could have a larger effect on price.
That dynamic would become increasingly relevant as BTC approaches $90,000 and eventually the $100,000 threshold, where profit-taking from older holders could introduce additional supply.
Higher Trading Activity Broadens Participation
Bitcoin's rally is also being accompanied by stronger market participation. Santiment reported that trading activity across Bitcoin and major altcoins had reached its strongest combined weekly level since early March, while total crypto trading volume jumped roughly 39% during the latest rally.
“Sudden volume expansion usually means the crowd has flipped from hesitation to conviction,” said in a Monday post on X, adding:
“More traders are chasing breakouts, rotating into altcoins, and reopening leveraged positions as confidence returns.”
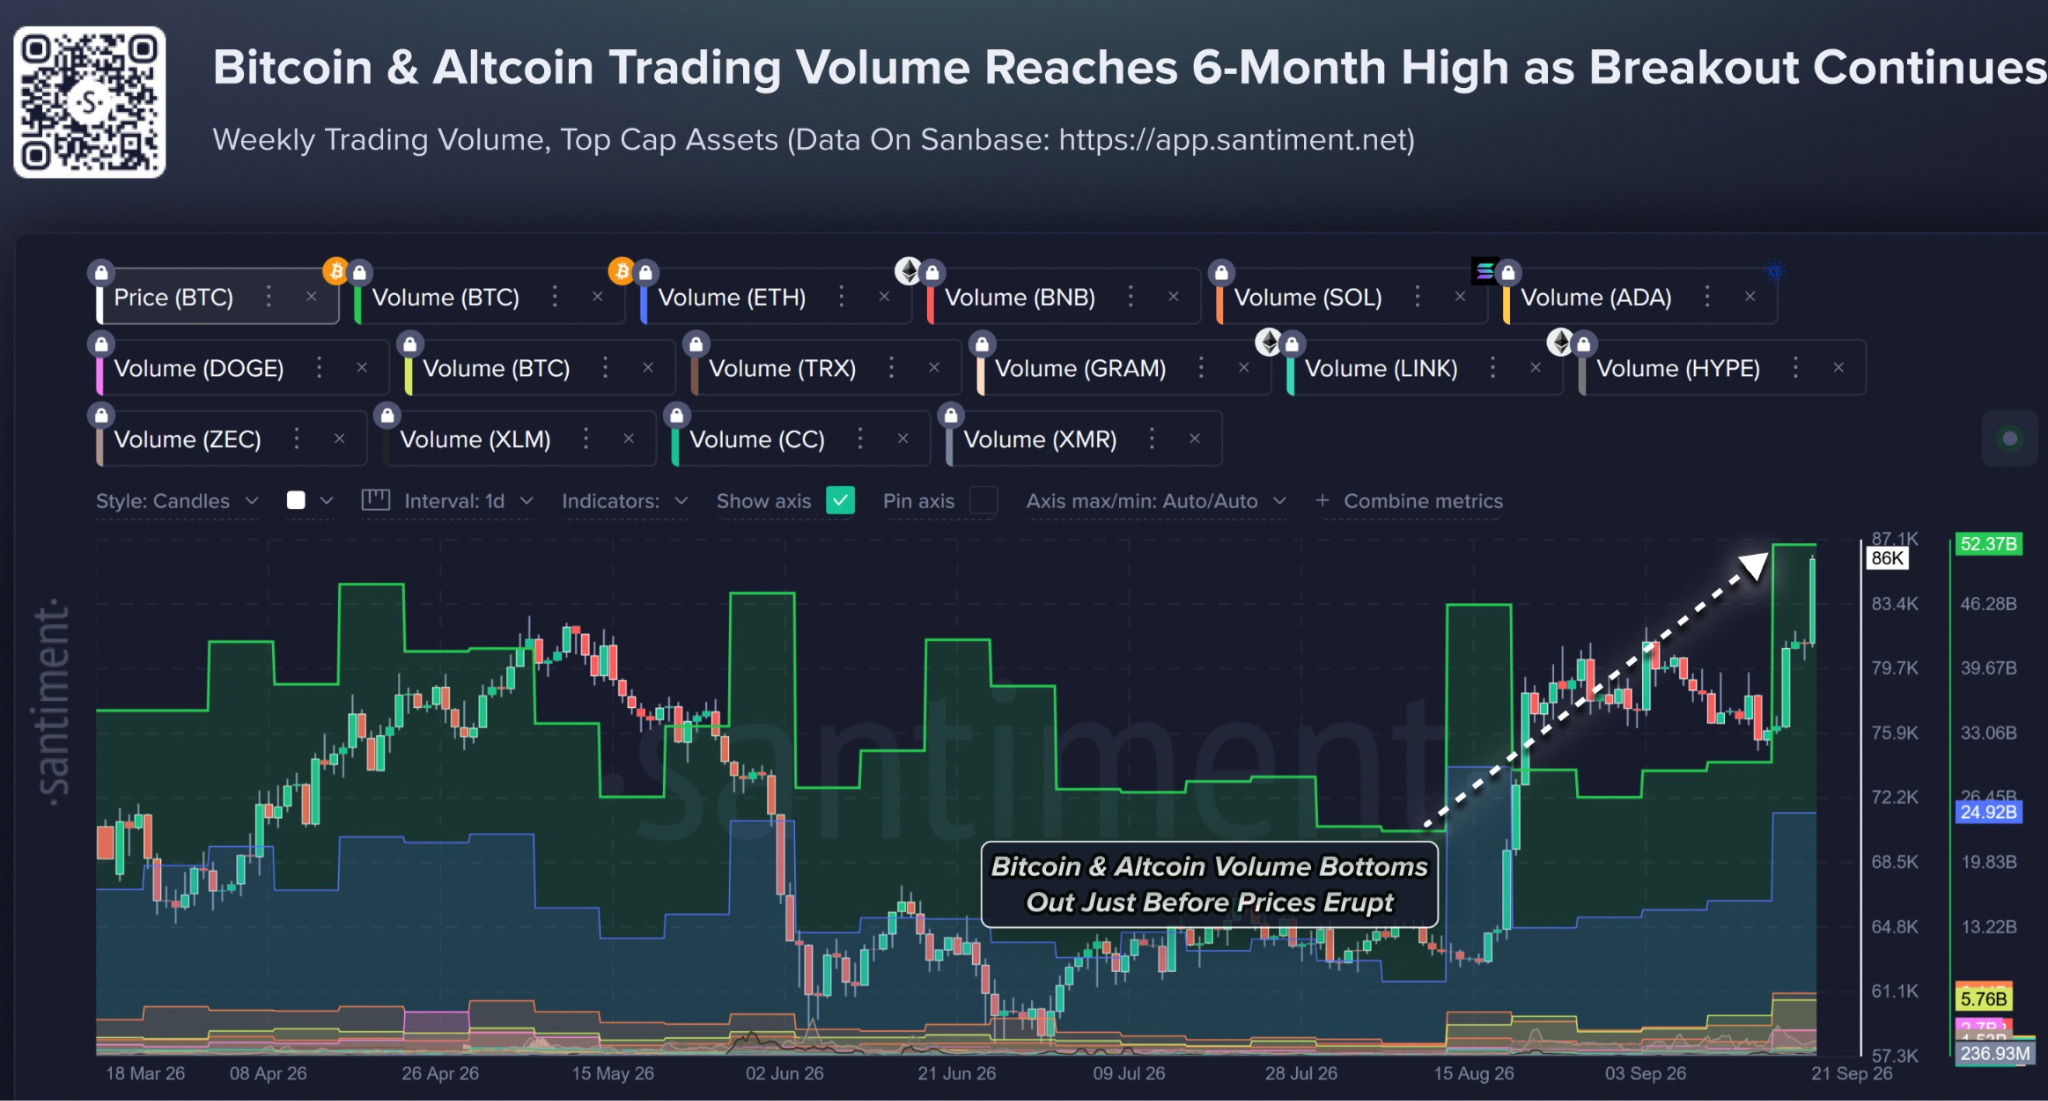
Bitcoin trading volume hits 6-month highs. Source: Santiment
Higher trading volume suggests the move occurred amid broader participation rather than simply drifting higher on thin liquidity. The surge also coincided with Bitcoin breaking above $85,000 and a large wave of short liquidations.
The continuation of the rally, therefore, depends on whether volume remains elevated during consolidations and pullbacks, rather than appearing only during vertical advances. Persistent spot demand would provide stronger evidence of accumulation than a temporary derivatives-driven surge.
The $90,000 Area Becomes Bitcoin’s Next Test
From a technical perspective, Bitcoin’s price has broken out of a bull pennant chart pattern on the daily chart (see below). Bulls are now focused on pushing the price above the immediate resistance between the $88,000-$90,000 supply zone.
A daily candlestick close above this level would confirm a breakout into six-figures, with the technical target set at $112,100 or a 19% increase from the current level.
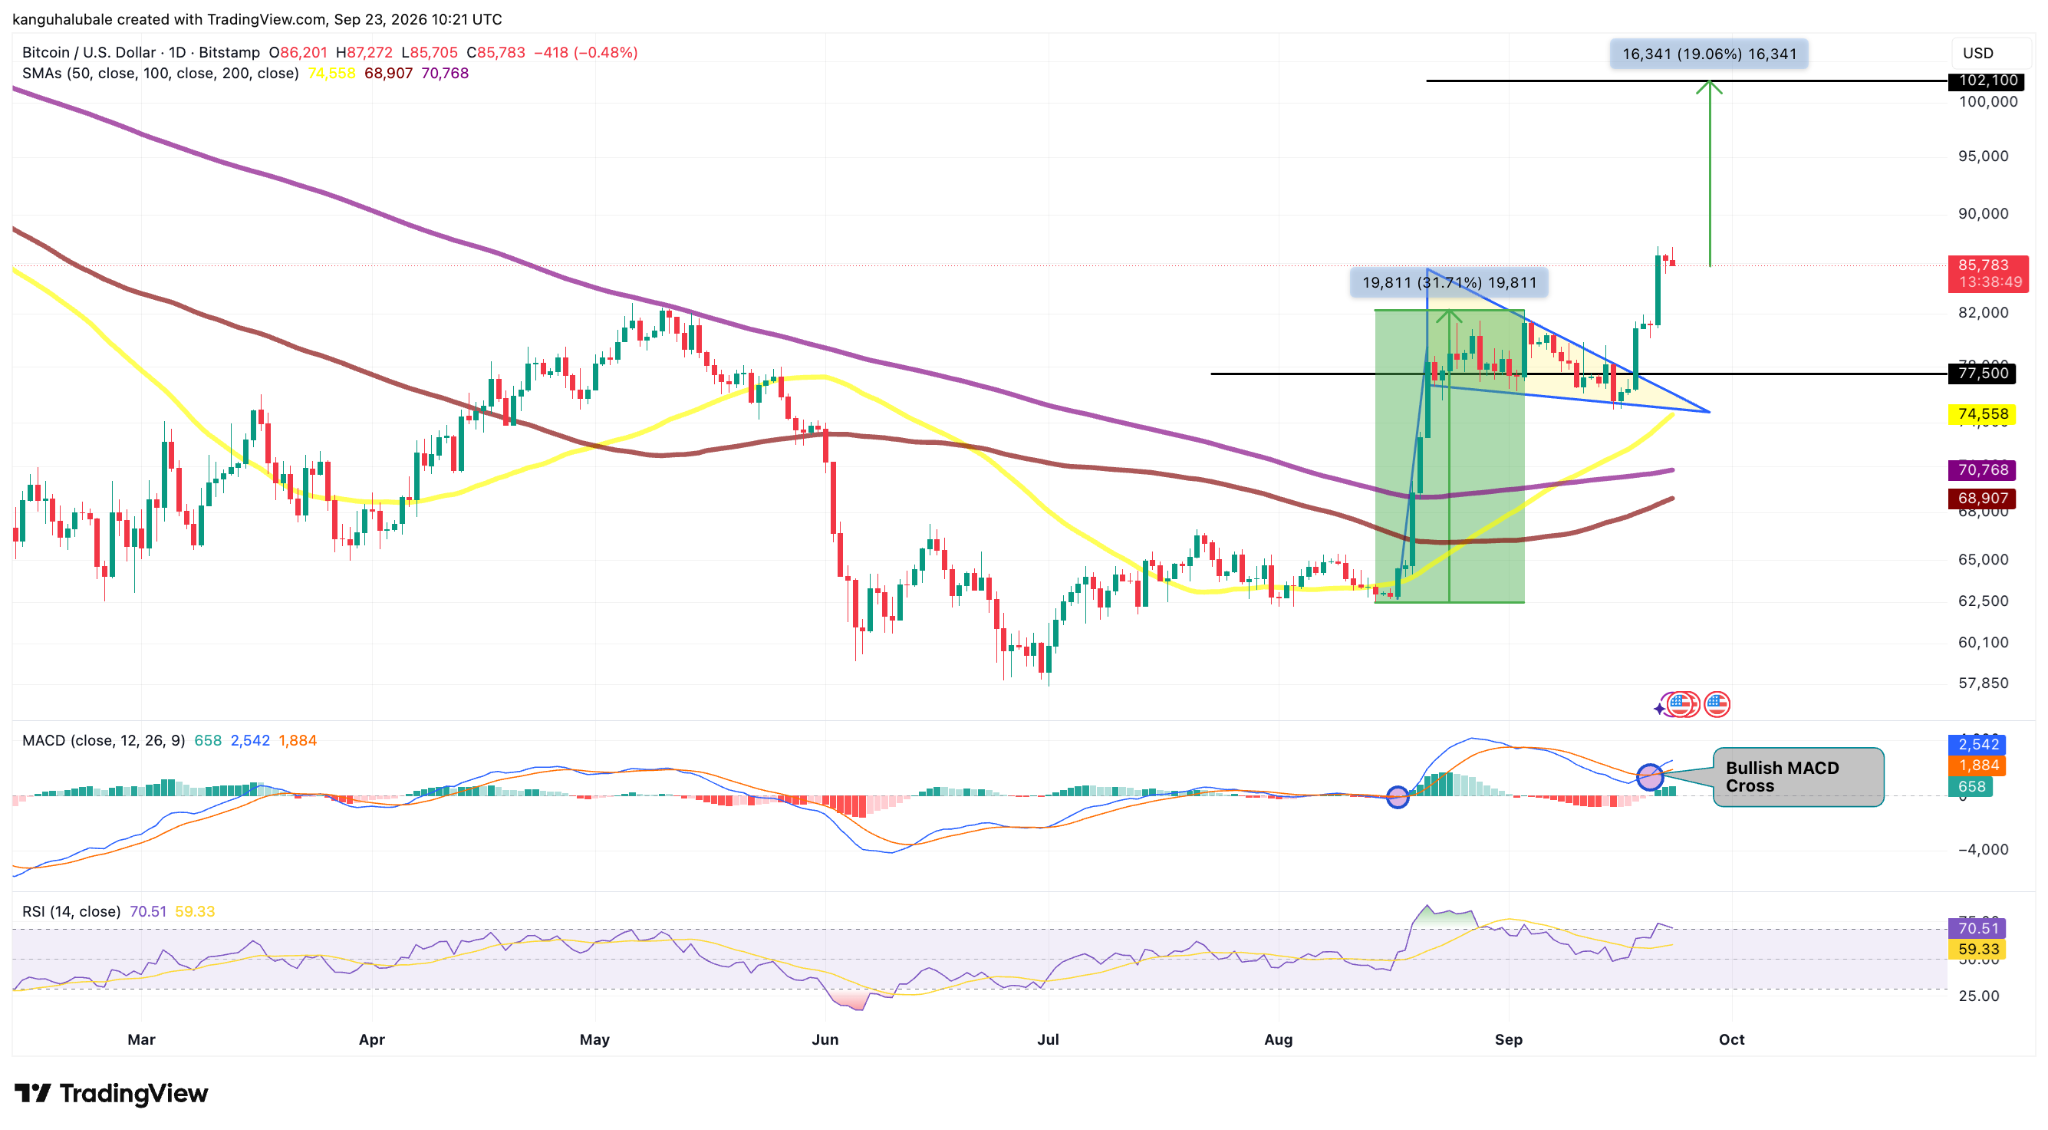
BTC/USD daily chart. Source: TradingView
The relative strength index, or RSI, is still in the positive region at 70, suggesting that the market conditions still favor the upside.
The Moving Average Convergence Divergence (MACD) indicator has also produced a “bullish” cross on the daily chart. This happened on Sunday when the MACD line (blue line) crossed above the signal line (orange). This suggested that market conditions had flipped in favor of the bulls. The last a similar MACD signal occurred in mid-August was followed by roughly a 32% BTC price increase.
At approximately $87,000, Bitcoin would need to gain about 15% to reach $100,000 and roughly 29% to reach $112,000. A sustained break above the $90,000 area would therefore be an important intermediate step before the market could seriously test six-figure resistance.
The pennant projection becomes more credible if it is accompanied by strong ETF inflows, declining exchange supply and sustained spot volume. Without those conditions, the pattern remains vulnerable to a failed breakout.
Bitcoin’s Momentum Now Faces a Tougher Test
Bitcoin's current structure suggests that the upside is not over for the pioneer cryptocurrency, but the market is also becoming more crowded. ETF inflows above $1.7 billion in two sessions, reclaimed long-term moving averages, negative exchange netflows and stronger trading activity all provide evidence of improving demand. Glassnode's MVRV crossover adds another historical signal associated with earlier recovery phases.
If these conditions persist, BTC could first challenge $90,000, with a sustained move through that area bringing $100,000 into the picture. The $112,000 bull-pennant projection would become relevant if momentum continues after the six-figure threshold.
The main risk is buyer exhaustion. The RSI has moved into overbought territory, while Santiment's FOMO measure has reached its highest level since late 2024. Short-term holders are also sitting on larger unrealized profits, increasing the potential for profit-taking if momentum stalls.
For now, the market is showing stronger confirmation than during the earlier recovery, but the next test is whether demand can absorb that profit-taking. A sustained hold above key support levels would keep the bullish structure intact, a sharp reversal below them would weaken the case for a short-term move toward $100,000.
Ready to trade our analysis of Bitcoin? Here’s our list of the best MT4 crypto brokers worth checking out.