


Buyers have again struggled to establish control near the top of the market’s recent structure, suggesting that bullish enthusiasm might be fading. Yet this is also a pair that has spent more than a year printing apparently turning points that eventually turn out to be of little consequence.
That leaves a more useful question than whether a bearish pattern can be drawn on the chart: is the market beginning to change, or simply returning to its usual rhythm?
Why the Retreat From 1.3550 Matters Now
The GBP/USD currency pair has spent considerably more than one year in a broad sideways range. That background changes how the latest bearish swing should be interpreted. A move lower from the upper part of a range is not unusual; it becomes significant only when sellers can push price through the support that previously contained similar pullbacks.
The recent formation near 1.3550 gives bears a credible reason to watch closely. Two failed attempts to establish higher ground can indicate that demand is becoming less willing to absorb supply at elevated levels. However, this currency pair has not yet moved in a way that clearly separates this episode from earlier range rotations.
Today’s data provide the immediate context. Yesterday’s US CPI report was relatively benign, with headline inflation rising 0.1% in July and core CPI increasing 0.2%, exactly as was widely expected. This did not create a compelling new inflation-driven case for USD strength. The UK’s monthly GDP estimate and the US PPI release due today offer the next opportunities for markets to reassess UK growth, US inflation pressure, and the relative policy outlook. If there are any surprises, this will increase the chance of consequential development.
Top Regulated Brokers
Why the Double Top May Be Easy to Over-read
The potential bearish double top chart pattern has peaks at, or just below, 1.3550. This is the principal resistance area, not just because it is a visible high, but also because attempts to move beyond it have lacked any sustained follow through. The pullback from that zone makes a significant bearish development more plausible.
Despite this, a visible pattern is not the same as confirmation. The GBP/USD currency pair has continued to find support near 1.3480, and that level remains a short-term dividing line. As long as buyers defend it, the decline looks more like a contained reaction beneath resistance than a completed bearish reversal.
The brief move above 1.3500 adds to the ambiguity. Bears can view the failure to remain above the round number as evidence that the upside attempt lacked conviction. Bulls can point out that price was able to trade above it at all and has not yet surrendered the nearby support structure.
A sustained break below 1.3480 would change the technical conversation. It would suggest that sellers are making progress beyond the upper-range rejection and would shift attention toward the more established 1.3435 support area. Until then, the chart shows pressure at resistance, but not a confirmed breakdown.
A break below the 1.3435 support level would be a more significant bearish pivot. Having said that, applying a linear regression analysis shows there is a symmetric bullish price channel and its lower trend line is confluent with 1.3480, so this level could be more pivotal than it first appears.
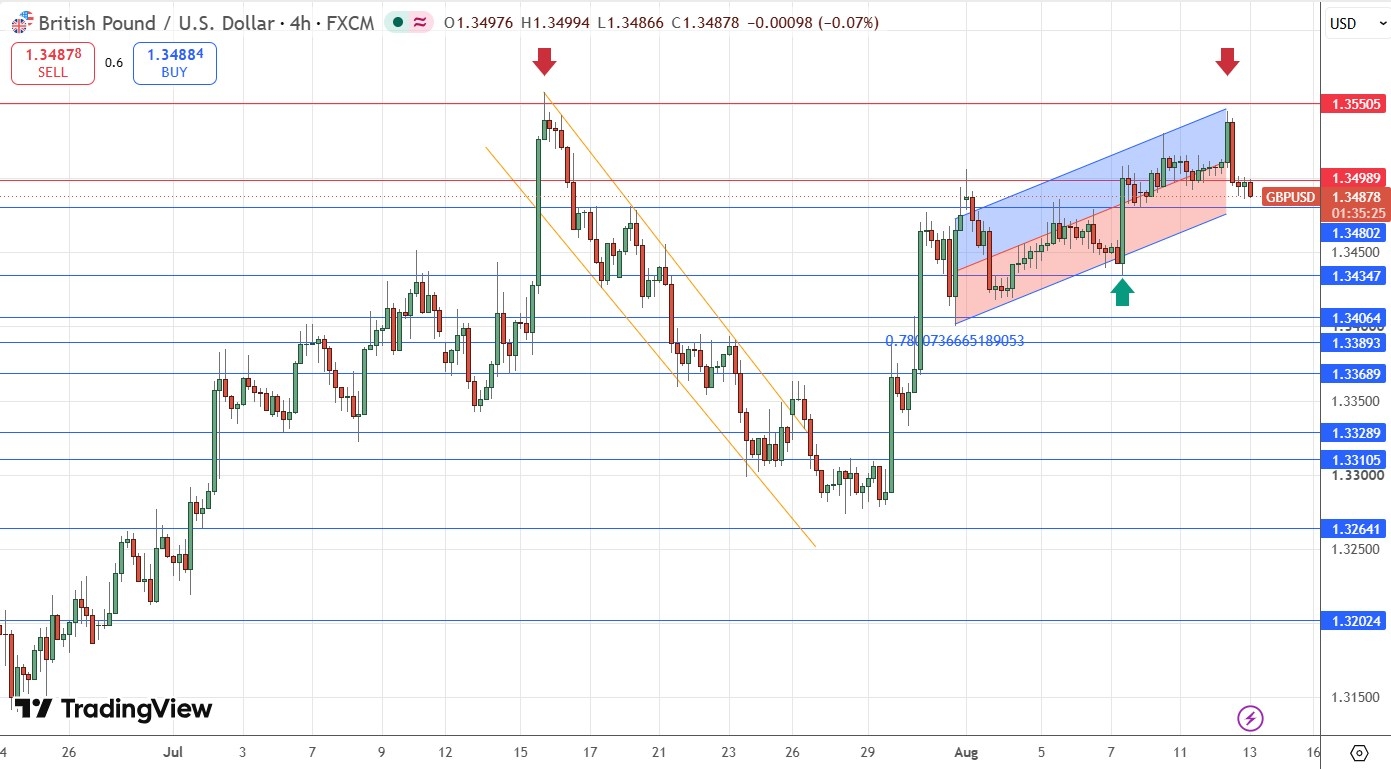
GBP/USD H4 Price Chart 24th July – 13th August 2026
The Level That Could Settle the Debate
Double tops are compelling because they make market uncertainty look orderly. The story appears straightforward: buyers tried twice, failed twice, and the next move should be lower. That logic can work in a trending market, but it is less reliable when the larger environment has repeatedly rewarded mean reversion.
The more important issue is the quality of the move after the second high. A meaningful reversal normally involves continued selling through support and an inability by buyers to reclaim lost ground. So far, the lack of a break below 1.3480 means that evidence is incomplete.
The market’s reaction to today’s high impact data may matter more than the data itself. UK GDP is expected to be flat after a prior 0.1% rise, while US headline PPI is expected to increase 0.2% month-on-month after June’s 0.3% decline. Weak UK activity or firmer-than-expected US producer inflation could make the bearish case more credible. Stronger UK data or softer PPI could instead reveal that dollar demand remains too fragile to turn a chart pattern into a broader move.
Is This a Reversal—or Another Range Rotation?
The alternative is not that the double top is irrelevant, but that it is functioning as the upper boundary of the established range. If 1.3480 holds and GBP/USD stabilises around, or reclaims, 1.3500, the retreat from the 1.3550 area would look like just another rotation rather than a structural change.
That would leave resistance unresolved and prevent a bullish breakout narrative. It would also mean that sellers had identified a ceiling without yet proving that they could create a new lower trading regime. The distinction matters because ranging markets often produce convincing bearish and bullish signals before neutralising both.
For now, GBP/USD is caught between a technically credible warning at 1.3550 and a support structure that has not yet given way. The next reaction around 1.3480 may show whether the market is finally assigning more weight to the downside—or whether the long-running range is still setting the terms of the debate.
Ready to trade our GBP/USD analysis? Here is our list of the best Forex brokers worth reviewing.