


When a currency pair fails to sustain a breakout after six months of upward momentum, the reversal often exposes a structural mismatch between conviction and positioning. GBP/USD has completed a textbook head-and-shoulders pattern and broken below the critical neckline, triggering institutional repositioning away from sterling as accumulated long positions face genuine downside vulnerability. This technical invalidation masks a deeper market assumption: that dollar strength persists on economic data confirmation alone—a vulnerability that central bank communications from Jackson Hole could rapidly overturn.
Top Regulated Brokers
Some analysts might see this as nothing more than the usual ebb and flow of the Forex market, but could it be that something more significant is going on here with the GBP/USD?
Institutional Positioning and Recent Catalyst
Yesterday’s US Dollar-related high-level economic data releases came in exactly as were widely expected – a 0.2% month-on-month increase in the PCE and Preliminary GDP showing growth at 1.5%. Despite the lack of surprise, it seemed to be the case that getting the data safely out of the way was the catalyst for some institutional positioning. The US Dollar gained as a result, and this suggests that the path of least resistance in a currency pair such as GBP/USD is now switching to bearish rather than bullish.
It is also worth noting that the biggest moves in the Forex market have historically tended to happen on Thursdays.
Finally, the price is moving firmly lower after repeatedly testing and eventually failing to break out of the top of its long-term range, with a new 6-month high briefly made, and the price now looking as if it is going to traverse that range in a downwards direction. This might give a strong reward to risk ratio opportunity to short traders.
Technical Setup: Head-and-Shoulders Completion Signals Bearish Shift
A few days ago, the technical picture was looking very bullish, and the price was threatening to break well above the 1.3650 area to go on to make fresh 6-month highs. It then began to look as if a bearish head and shoulders chart pattern was forming, but the neckline held. We now see a crucial lower high developed and the price finally pushed below the obvious neckline area near 1.3600, so it may be that this head and shoulders pattern finally completed after all. Both that and the repeated failures to exceed the high earlier are bearish signs of exhaustion amongst buyers.
Turning to horizontal support and resistance, the price action has printed new resistance levels, and the one that is holding now and easily absorbing attempts at buying is very confluent with the round number at 1.3600. This suggests that the first part of the London session today is likely to see a move lower. The former support level at 1.3618, which held cleanly as support, has now flipped very cleanly to become new resistance, and that is one of the most bearish signs you can see in the Forex market.
I have not marked it as a defined level, but support might well start to be felt at 1.3565 next.
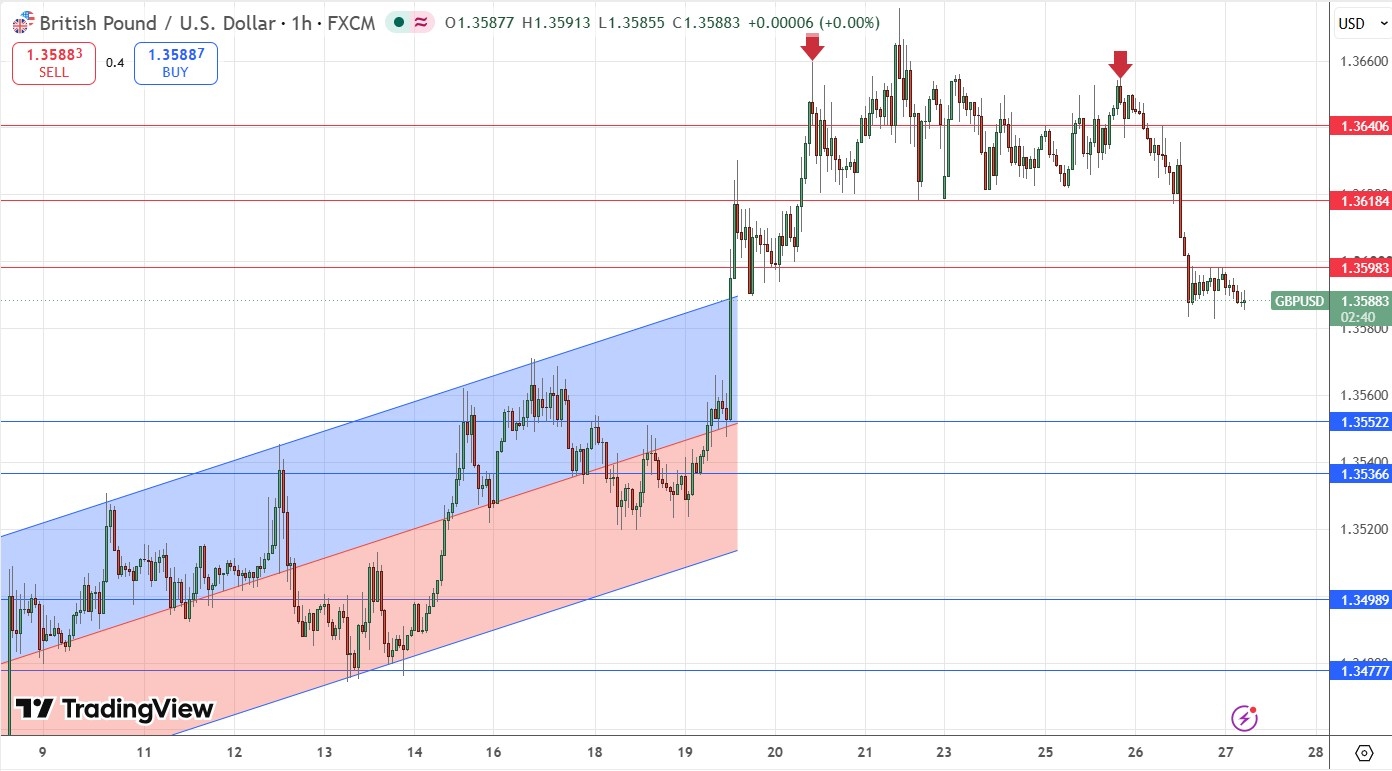
GBP/USD H1 Price Chart Showing Shoulders
Behavioral Blind Spot: Jackson Hole Volatility Risk
The problem with technical analysis is that it tends to work in the absence of other disruptive factors which might appear from time to time: put simply, news about something which materially affects the perceived valuation of either currency in a currency pair. So, what might affect the British Pound or US Dollar that would upend consideration of technical factors? Most obviously, some form of surprise from relevant central bankers at this weekend’s Jackson Hole Symposium, or even very hawkish or dovish comments from the Fed Chair or more than a single FOMC member, might shift the market’s attitude to the US Dollar materially.
It is challenging to think of a similar risk to the British Pound. Some kind of European flare-up over Russia and Ukraine could hurt the Pound and might also produce a flow into the US Dollar as a safe haven when European currencies take a knock.
Alternative Bullish Scenario
Although technical and sentimental factors suggest the next major price movement will be lower, how might an alternative bullish scenario play out? There is a long-term bullish trend here, even though it is not very strong, but it has persisted over many months and could still provide a residual which will see prices moving higher again. Although the current bearish move looks serious, what if this is just a bearish retracement?
I see the most likely bullish scenario as being a move lower to 1.3565 / 1.3550 which then produces a strong bullish bounce, sucking in longs who push the price upwards to make a new 6-month high price, or at least back above the level at 1.3600 which looks like it has potential to be today’s pivotal point.
GBP/USD is worth watching because it has failed to break to a new long-term high, is showing bearish price action, and has a long way to fall while remaining within its dominant range, suggesting there could be a good opportunity to get involved on the short side. Alternatively, the pair may surprise if the long-term bullish trend reasserts itself and produces a fresh high within the next few days. Sentiment on the US Dollar and any surprises at Jackson Hole at the end of this week may prove crucial.
Ready to trade our GBP/USD analysis? Here is our list of the best Forex brokers worth checking out.