


Bullish view
Buy the EUR/USD pair and set a take-profit at 1.1600.
Add a stop-loss at 1.1450.
Timeline: 1-2 days.
Bearish view
Sell the EUR/USD pair and set a take-profit at 1.1450.
Add a stop-loss at 1.1600.
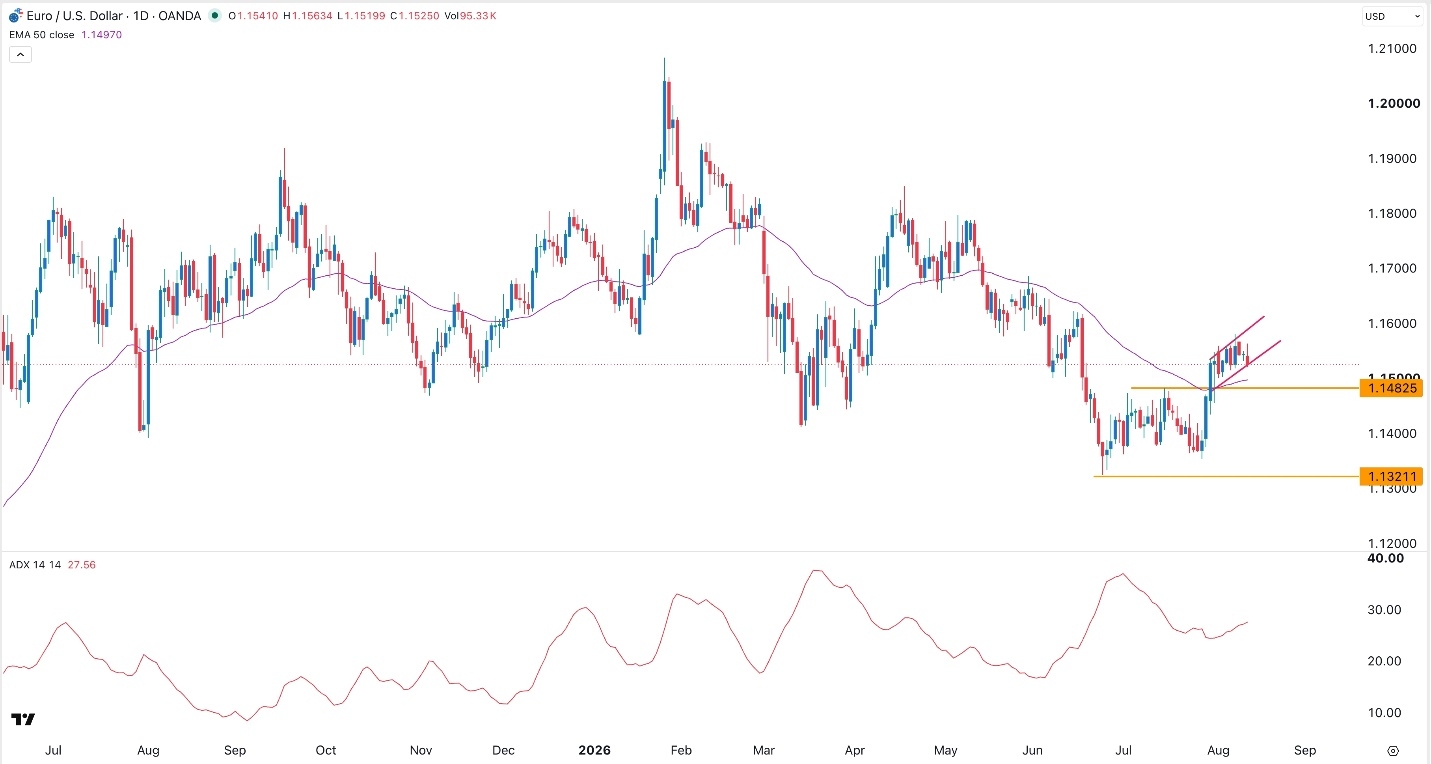
The EUR/USD exchange rate pulled back slightly as traders reacted to the US inflation report, which showed that prices softened a bit in July. It dropped to 1.1524, slightly lower than this month’s high of 1.1578.
US to Report PPI Inflation Data
The EUR/USD pair fell slightly after the Bureau of Labor Statistics (BLS) published the latest consumer price index (CPI). This report showed that inflation eased a bit in July, even as the US-Iran war resumed.
The headline CPI rose 0.1% in July from a month earlier and 3.4% from the previous year on a seasonally adjusted basis. The closely watched core consumer inflation that strips out volatile food and energy prices, rose 2.5% during the month.
This report came at a time when Federal Reserve officials are weighing whether to hike rates this year. In its last meeting, three officials voted to hike rates. And in a recent statement, Cleveland Fed’s Beth Hammack supported hiking rates, noting that inflation has remained above the 2% target for over five years.
US inflation has been elevated because of President Trump’s tariffs and his war against Iran. While fighting has stopped for now, the Strait of Hormuz is still closed, and the Houthis are still attacking Saudi Arabian ships crossing the Bab el-Mandeb Strait.
The next important catalyst for the EUR/USD pair is the upcoming Producer Price Index (PPI) report. Economists expect the report to show that the headline PPI rose from minus 0.3% in June to 0.2% in July, while the core PPI moved from 0.2% to 0.3% in July.
Top Regulated Brokers
The other minor catalyst for the pair will be the European industrial production report. Economists expect this data to show that production dropped by 0.1% from a month earlier and by 0.8% from a year earlier.
EUR/USD Technical Analysis
The EUR/USD pair has lost momentum in the past few days. It has pulled back from this month’s high of 1.1578 on August 7 to the current 1.1523. The Relative Strength Index (RSI) has dropped from 63 to the current 55.65.
On the positive side, it has formed a bullish flag pattern, which is made up of a vertical line and a horizontal channel. Also, it remains above the 50-day Exponential Moving Average (EMA).
Therefore, the pair will likely bounce back in the coming days. More upside will be confirmed if it moves above the key resistance at 1.1578.
Ready to trade our free trading signals? We’ve made a list of the best European brokers to trade with worth using