


H1 options
Crypto Prices Roar Higher, Prompting Some To Warn of a Bull Trap
Top Regulated Brokers
Don't Get Fooled by the Green Charts: Why Crypto's Broad Rally Isn't What It Seems
The Hidden Disconnect Inside Crypto's Biggest Weekly Move in Months
XRP Rallies 45%+ in Strongest Crypto Rally of 2026
Markets have a way of making participation look simpler than it is. When prices rise broadly and the numbers are large, it becomes easy to treat the whole crypto market as one unified thing moving in one direction. That framing usually costs something.
Over the back half of the past week, the crypto market produced one of its more striking weekly advances in recent memory. The move was wide by most measures and involved names that do not usually share the same column. What it did not produce was a tidy explanation or uniform gains.
The question heading into the week ahead is what kind of advance this was.
Starting in ernest on Wednesday, the broad rally extended into Friday before the crypto market gave back part of the late-week acceleration on Saturday. According to CoinMarketCap, Total capitalization dipped to $2.6 trillion after peaking at a high of $2.68 trillion, but the weekly advance remained strongly positive despite the weekend consolidation.
That weekly move was hard to dismiss on breadth. In a reversal from previous write-ups, the top 100 skewed sharply positive, with 86 winners, 13 losers, and one unchanged.
A cleaned top-50 screen, excluding stablecoins and obvious duplicates, returned 33 positive, zero negative, and one unchanged. And these weren’t just minor price movements. The median gain was approximately +19.11%, while the cap-weighted field was approximately +23.25%.
Bitcoin (BTC) dominance currently sits at 59.4%, underscoring that broad participation and a large Bitcoin share still coexists, though dominance moved modestly lower rather than higher across the week's final sessions.
DeFiLlama's USD-pegged stablecoin circulation rose approximately $2.13 billion, or about 0.70%, from August 14 to August 22. Data from Farside for August 17 through 21 showed approximately $1.918 billion entering U.S. spot-BTC funds and $692.6 million entering spot-Ether (ETH) funds.
But broad participation did not erase the leadership gaps. On an established-liquid screen, XRP gained roughly 45% and ETH gained nearly 28%. BNB rose approximately 14%, while Monero (XMR) and Tron (TRX) advanced only a few percent. Those laggards remained positive. The gap shows why broad participation and uniform performance are different claims.
The simple overview shows a market with broad strength, a large Bitcoin share, constructive participation signals, and a visible spread between leaders and laggards. The nuance is presented below.
Price Action
Four pairs illustrate the range. All four were above both moving averages and positive across every window. Their differences matter more than the shared green sign.
BTC/USD
Against that market backdrop, BTC/USD was near $76,816 on the TradingView Coinbase feed at the time of writing, with weekly performance of approximately +22.09%. The Coinbase fixed window showed a gain near +21.22% within a $62,468 to $79,500 range.
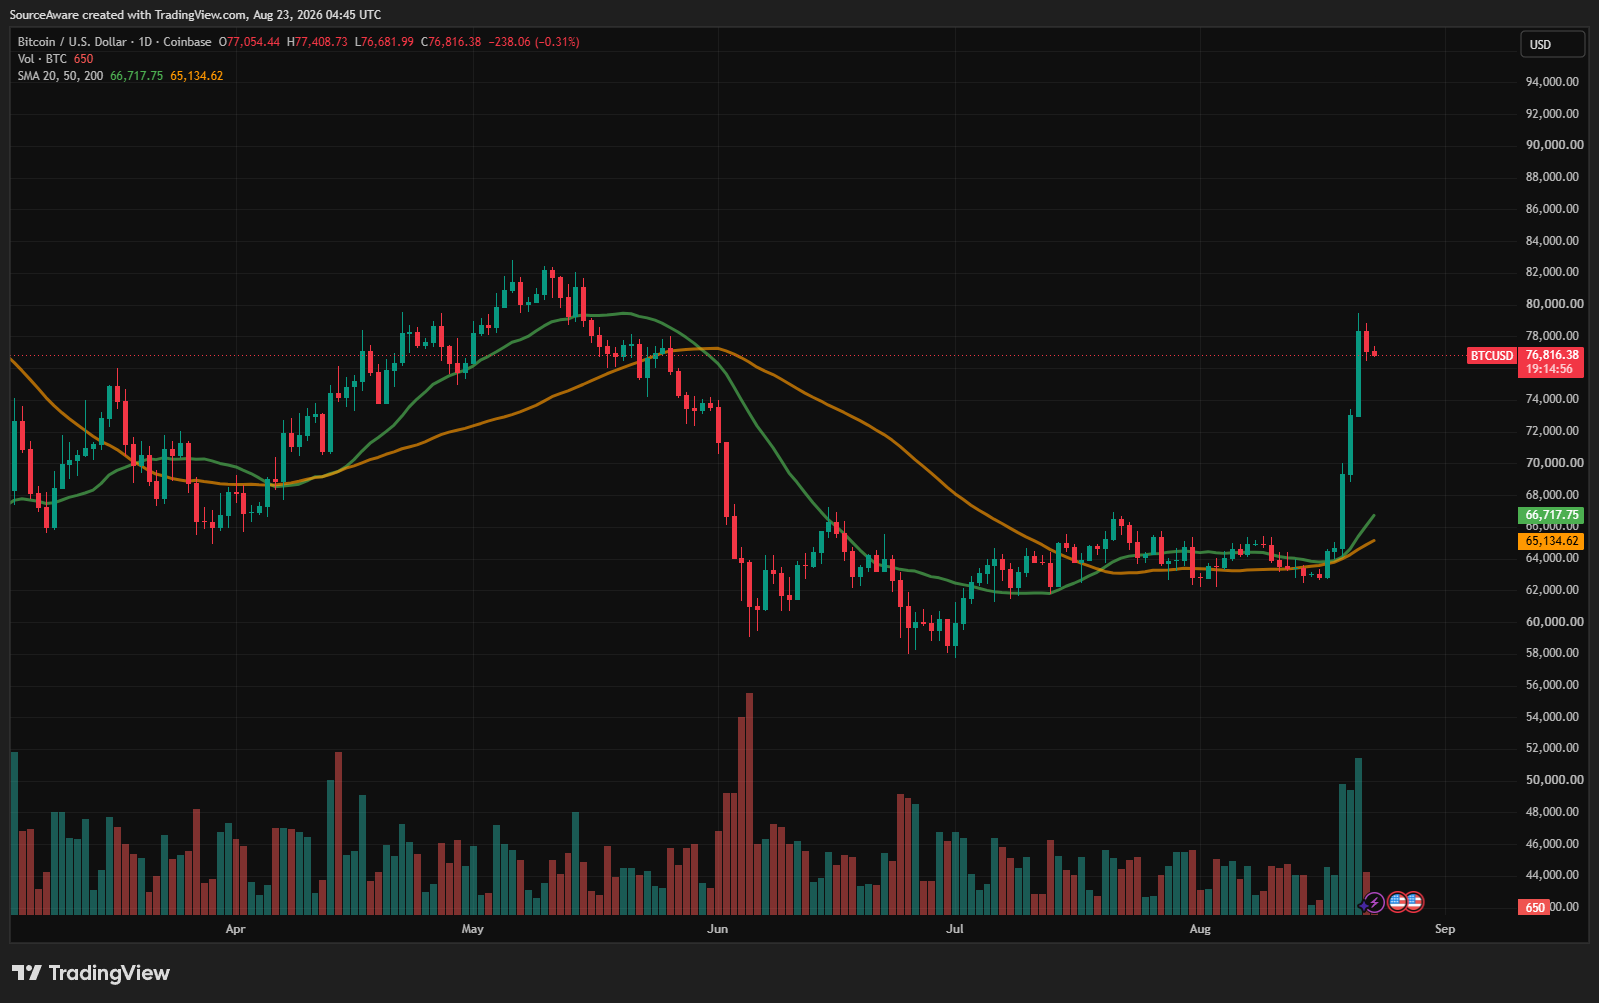
BTC/USD 1-day chart. Source: TradingView
Price was above the 20-day average near $66,717 and the 50-day near $65,134. Bitcoin supplies the benchmark for broad repricing and the dominance test.
XRP/USD
At the leadership end, XRP/USD was the week's strongest selected established-liquid name by a wide margin. At the time of writing, TradingView showed approximately $1.4564 and weekly performance near +45.88%. The Coinbase fixed window showed a gain near +44.72%, within a $0.9873 to $1.6996 range.
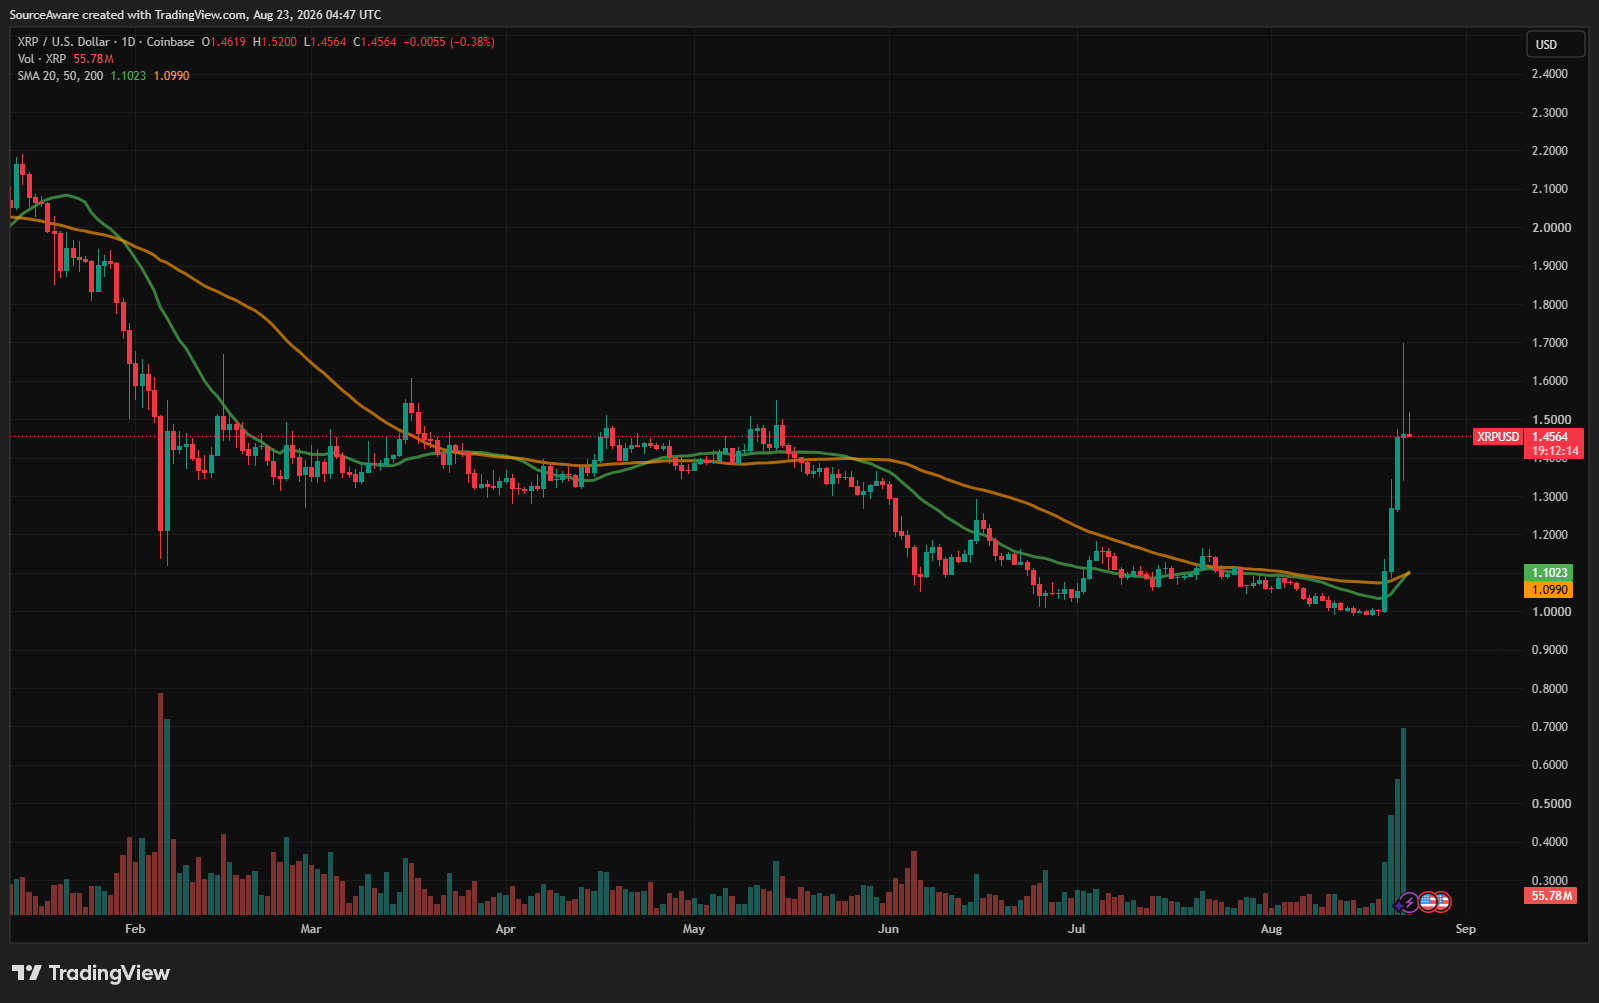
XRP/USD 1-day chart. Source: TradingView
Price was above its 20-day average near $1.1023 and 50-day average near $1.0990. No primary source proves an asset-specific catalyst. The SEC's August 18 proposal is verified policy context, but it does not establish price causation.
ETH/USD
Behind XRP, Ether was trading near $2,382 on the TradingView Coinbase feed at the time of writing, with weekly performance of approximately +28.24%. The Coinbase fixed window showed a gain of roughly +27.83%, with an observed range of $1,862 to $2,548. The 20-day SMA was near $2,014 and the 50-day near $1,918; price was above both.
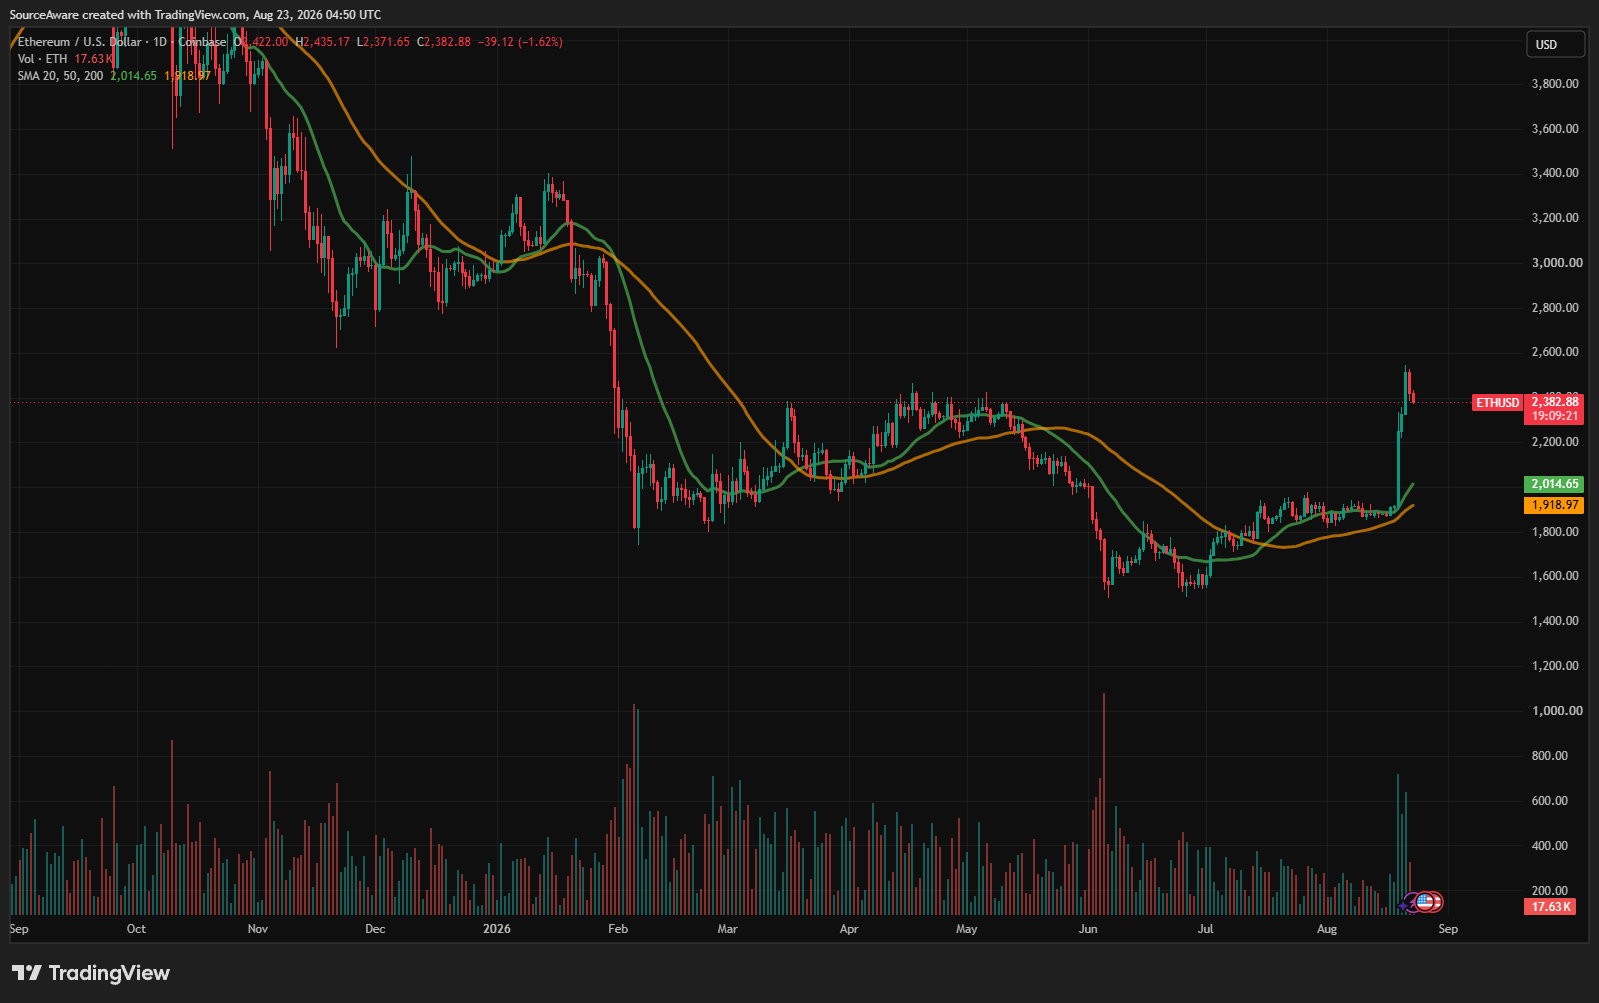
ETH/USD 1-day chart. Source: TradingView
Farside data for August 17 through 21 showed spot-ETH funds accumulating approximately $692.6 million. ETH illustrates large-cap leadership that materially outpaced Bitcoin's benchmark gain while remaining well behind XRP's weekly advance.
BNB/USD
At the slower end of the selected group, Binance’s BNB traded near $683 on the TradingView Coinbase feed at the time of writing, with weekly performance of approximately +14.23%. The Coinbase fixed window showed a gain of roughly +13.57%, with an observed range of $599.26 to $725.78. The 20-day SMA was near $618.98 and the 50-day near $592.54; price was above both.
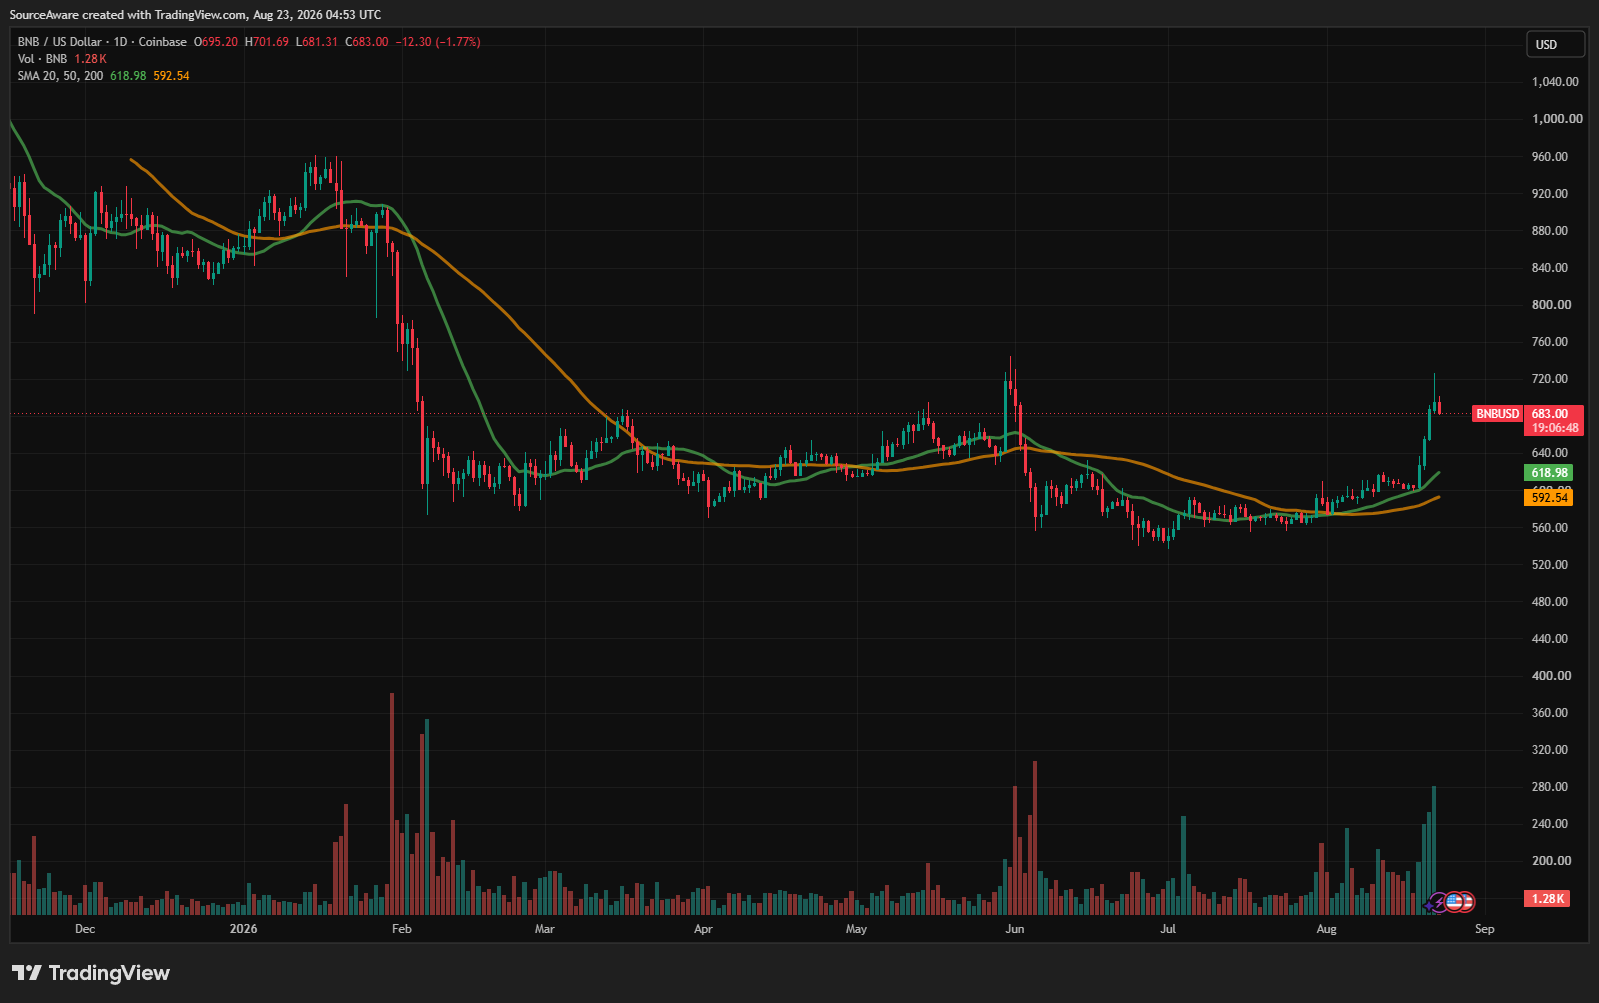
BNB/USD 1-day chart. Source: TradingView
BNB's week was positive across every measure and above both moving averages, but its gain was roughly 32 percentage points below XRP's and roughly 14 points below ETH's. That gap inside the large-cap group is the data point BNB is here to provide: a broad market advance can still carry meaningful dispersion among names that are supposed to be most similar.
Blind spots to note
Taken together, the advance was large enough that durability becomes the live question. The week compressed a large part of the repricing into a short window near its end. A reading of 86 positive assets out of 100 is wide, but the decline from the late-morning count shows how quickly the tone can change.
Bitcoin dominance remaining above 59% while breadth stayed this wide invites misreading in either direction. The whole market moved and Bitcoin retained a large share; dominance edged slightly lower across the week's final sessions rather than rising further. Whether that small reversal in dominance is noise or the start of a rotation is not something the available data resolves.
The stablecoin and fund-flow figures are supportive context, not evidence of a sustained supply source. Stablecoin circulation grew roughly 0.70% over eight days. Fund flows covered five completed sessions and applied only to specific U.S. products. Neither figure is large enough to explain a 20-plus percent weekly move in total capitalization.
The Case for a Bull Trap
The same data supports a more cautious read if the weekend closes differently. An 86/13 rolling breadth reading looks strong, but a short-lived late-week acceleration would leave the seven-day figure carrying one event that the rest of the week did not support.
The dispersion inside the large-cap screen allows a different interpretation: if XRP and ETH led because capital was rotating toward specific assets rather than the market broadening uniformly, then BNB's relative lag is less a sign of healthy dispersion and more a sign that the advance was narrower than the breadth numbers suggest.
The cleaned screen excluded enough assets that the 33/0/1 figure covers only a slice of what the broader market was doing. Neither reading is provable from the available data. Both remain open.
Looking Ahead
The crypto market spent a week producing numbers that are easy to describe and harder to characterize. Wide breadth, a large Bitcoin share, a significant late-week acceleration, and visible gaps between leaders and laggards can all be true at the same time.
Whether the participation that arrived late in the week holds into the next one, whether the laggards close the gap or the leaders exhaust, and whether the breadth numbers look different after a complete weekend close are questions the week left open.