


Bullish view
Buy the BTC/USD pair and set a take-profit at 85,000.
Add a stop-loss at 75,000.
Timeline: 1-2 days.
Bearish view
Sell the BTC/USD pair and set a take-profit at 75,000.
Add a stop-loss at 85,000.
Top Regulated Brokers
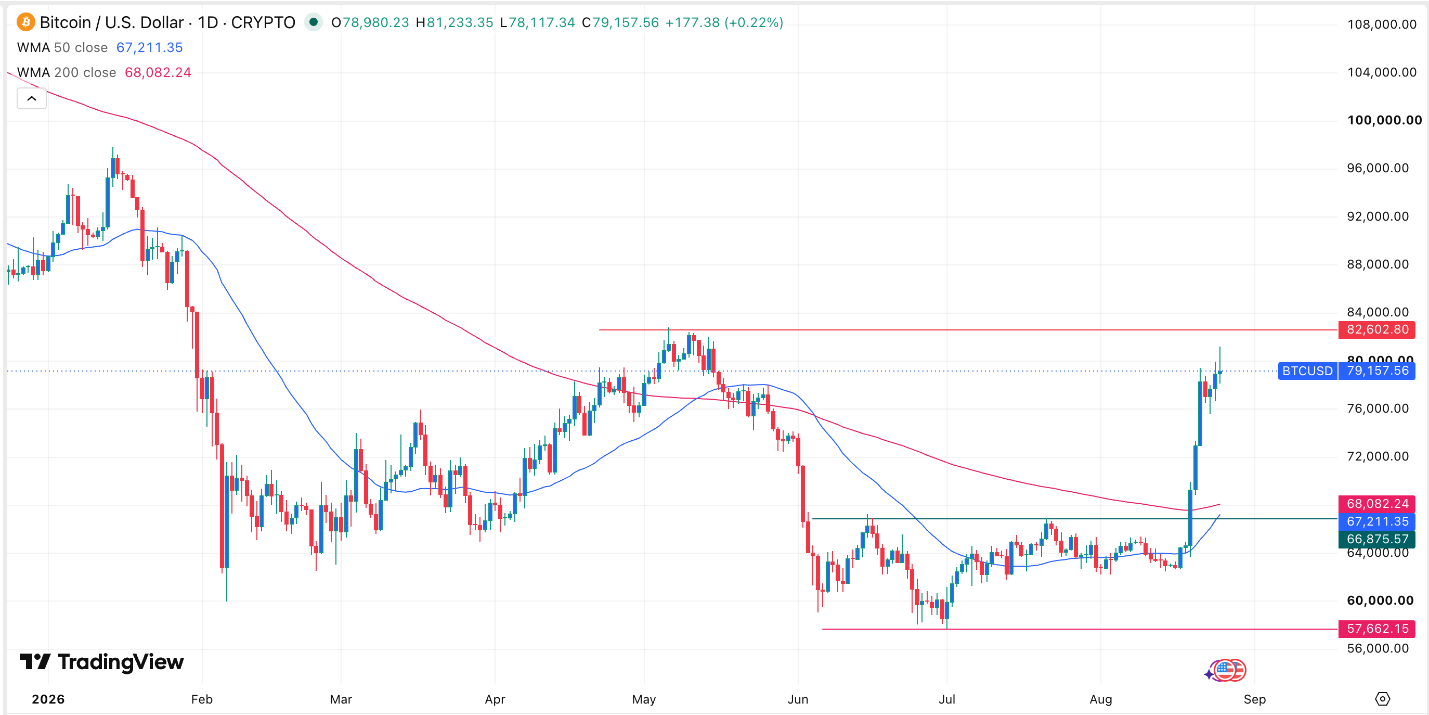
Bitcoin price held steady on Wednesday morning and is hovering near its highest level since May this year. The BTC/USD pair was trading at the crucial resistance level of 80,000, much higher than last week’s low of 62,300. This rally may continue as ETF inflows jump and as a golden cross pattern nears.
Bitcoin Price Steady as Fundamentals Improve
The BTC/USD pair has remained in a bull run this week as investors moved to Bitcoin and other cryptocurrencies. Data shows that spot Bitcoin ETFs have added over $2 billion in assets this month, with BlackRock’s IBIT leading the way. IBIT now holds over $60 billion in assets, while Fidelity’s FETH holds $13.8 billion.
More data shows that the amount of Bitcoin in exchanges has continued to fall this month, a sign that accumulation is continuing. This accumulation is happening among retail and institutional investors.
Bitcoin has done well as investors embraced a risk-on sentiment. Data shows that the Crypto Fear and Greed Index jumped to the extreme greed zone of over 80. This is an important gauge that looks at key multiples, including Bitcoin prices and activity in the derivatives market.
Looking ahead, the next important catalyst for Bitcoin will be the US macro data. The US will publish the latest GDP and personal consumption expenditure (PCE) data. Economists expect the data to show that inflation retreated a bit in July. Previously, the headline and core consumer price index (CPI) dropped to 3.5% and 2.4%, respectively.
These numbers come two days before a crucial statement from Kevin Warsh, the head of the Federal Reserve. His statement will provide more information on what to expect from the bank later this year.
BTC/USD Technical Analysis
The daily chart shows that the BTC/USD pair has remained in a bull market this week and is hovering near its highest level this month. A closer look shows that the 50-day and 200-day weighted moving averages (WMA) are about to cross each other. This pattern often leads to more gains.
The risk, however, is that the Average Directional Index (ADX) has started moving downwards, a sign that the rally is losing momentum. Also, there is a risk that bears may attempt to fill the gap created late last week. Most notably, it is struggling to move above 82,600, its highest level in May.
Therefore, while the pair may continue rising to 85,000, there is also a risk for a pullback as investors start booking profits.
Ready to trade our daily Forex signals? Here’s a list of some of the best crypto brokers to check out.