


Bearish view
Top Regulated Brokers
Sell the AUD/USD pair and set a take-profit at 0.6925.
Add a stop-loss at 0.7150.
Timeline: 1-2 days.
Bullish view
Buy the AUD/USD pair and set a take-profit at 0.7150.
Add a stop-loss at 0.6925.
The AUD/USD exchange rate jumped to the highest level since June 17 as investors reacted to several market-moving events in the forex market. It has jumped by over 2.4% from the lowest point in June as focus shifts to key macro data and events.
Australian Dollar Jumps Ahead of Key Events
The AUD/USD pair has been in a strong uptrend in the past few days as traders reacted to key events. For one, the Federal Reserve decided to leave interest rates unchanged between 3.50% and 3.75%. Some officials voted to hike interest rates, citing the elevated consumer inflation, which has remained above the 2% target for over five years.
The pair also jumped after President Donald Trump decided to halt the planned attacks against Iranian power plants and other critical infrastructure. Trump did that after coming under intense pressure from Saudi Arabia’s Prince Mohammed bin Salman and other Gulf allies.
The new phase of the war would have been more dangerous than the other stages. For one, it comes at a time when the Strait of Hormuz and Bab el-Mandeb are still closed. It would have also led to major attacks on oil and gas infrastructure projects in the region, making it hard for the sector to recover.
The AUD/USD pair will next react to the upcoming US manufacturing PMI report by the ISM and S&P Global. Economists expect the ISM data to show that the PMI jumped to 54 in July from 53.3 in June. The S&P data is expected to move from 53.9 to 53.8. A PMI reading above 50 is a sign that a sector is growing.
The other major numbers will be Australia’s household spending data on Tuesday and the US nonfarm payrolls (NFP) report on Friday this week.
AUD/USD Technical Analysis
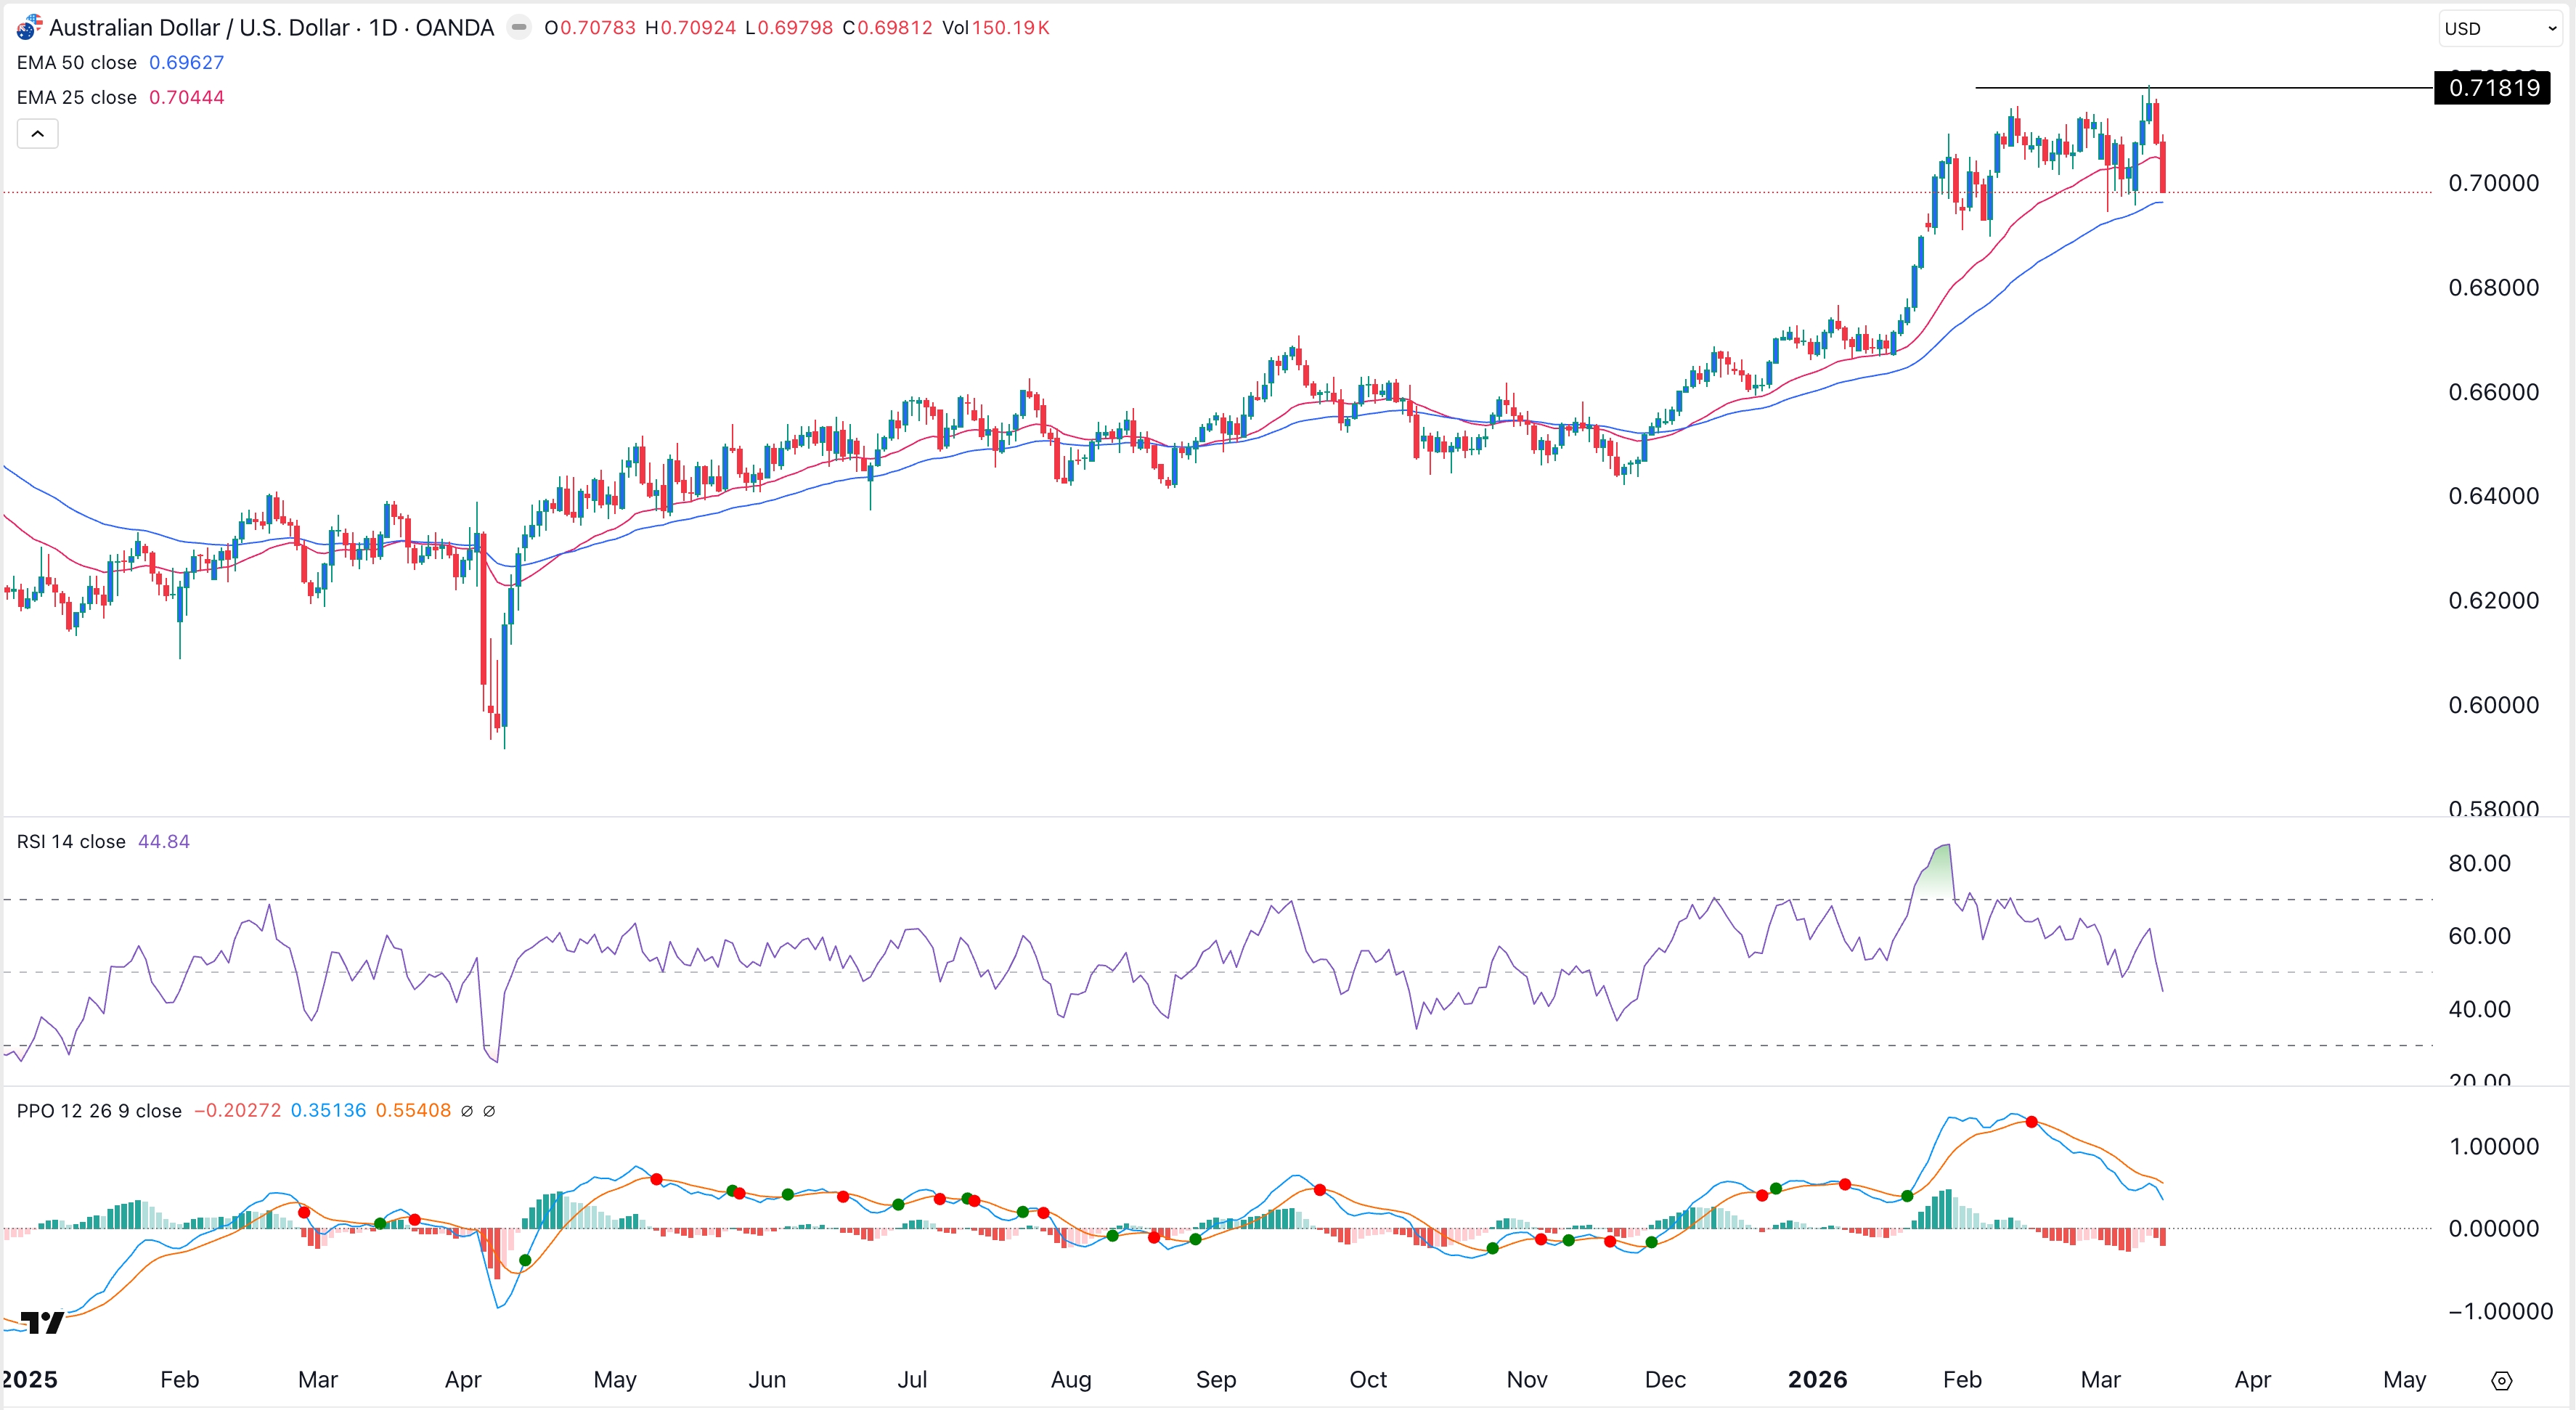
The daily chart shows that the AUD/USD pair has staged a strong uptrend in the past few weeks. It has jumped from a low of 0.6864 in June to the current 0.7030. It has formed an ascending channel and moved above the 50-day Exponential Moving Average (EMA).
The Relative Strength Index (RSI) has jumped above the important neutral level of 50 and is sitting at 57.70. It has moved above the Supertrend indicator, which has turned from red to green.
The risk, however, is that the pair has formed a bearish flag pattern. As such, the price may resume the downward trend in the near term, potentially to the key support of 0.6920, its lowest level on July 29. A move above the key resistance at 0.7100 will point to more gains.