


Gold has just tested and briefly cleared a major support zone, with the price spiking to $4,100 after today’s US CPI print came in at 3.5% versus 3.8% expected. The biggest question the market faces now is whether that support band between $4,000 and $3,900 can keep acting as a floor, or whether this latest rally merely offers temporary relief in a still-sluggish trend. The past couple of months have left Gold struggling to find direction as traders debate what bonds and the US Dollar will do next.
How Lower CPI Data Has Shifted the Immediate Narrative for Gold
The overall backdrop in recent weeks has been one of higher interest rates, especially in the United States, which usually weighs on non-yielding assets such as Gold. Higher yields make it easier for major market participants to get paid to hold fixed income instead of storing a massive amount of metal, and that has been a clear headwind for Gold over the past couple of months. Today’s CPI surprise, however, introduces a new twist: inflation falling to 3.5% instead of the 3.8% markets had expected.
That softer print briefly pushed Gold up to $4,100 as traders reassessed how aggressively the Federal Reserve may need to stay on the front foot. The move suggests that even in a higher-rate environment, Gold can still respond strongly when data undermines the case for tighter policy. The question is whether this reaction marks the start of a more durable shift in tone, or just another sharp move within a broader, indecisive range.
Top Regulated Brokers
The $4,000–$3,900 Band as the Market’s Current Line in the Sand
We currently find ourselves hovering around a major support area, with $4,000 acting as the most visible reference point and $3,900 serving as the deeper line in the sand. This band has attracted a lot of attention and has held on multiple tests, even as momentum has tilted lower over the last few months. Buyers need this zone to remain intact if they are to build any kind of base from which a more convincing advance can develop.
Recent price action has looked like a market chipping away at that support, but so far the lower boundary has not given way. From a behavioral perspective, the longer this range holds, the more “market memory” accumulates around it, raising the stakes for any eventual break. A clean move below $3,900 would likely see sellers grow more aggressive as buyers exit in self-defense, while a series of higher lows above $4,000 after today’s CPI surprise would signal that Gold is attempting to carve out a bottom.
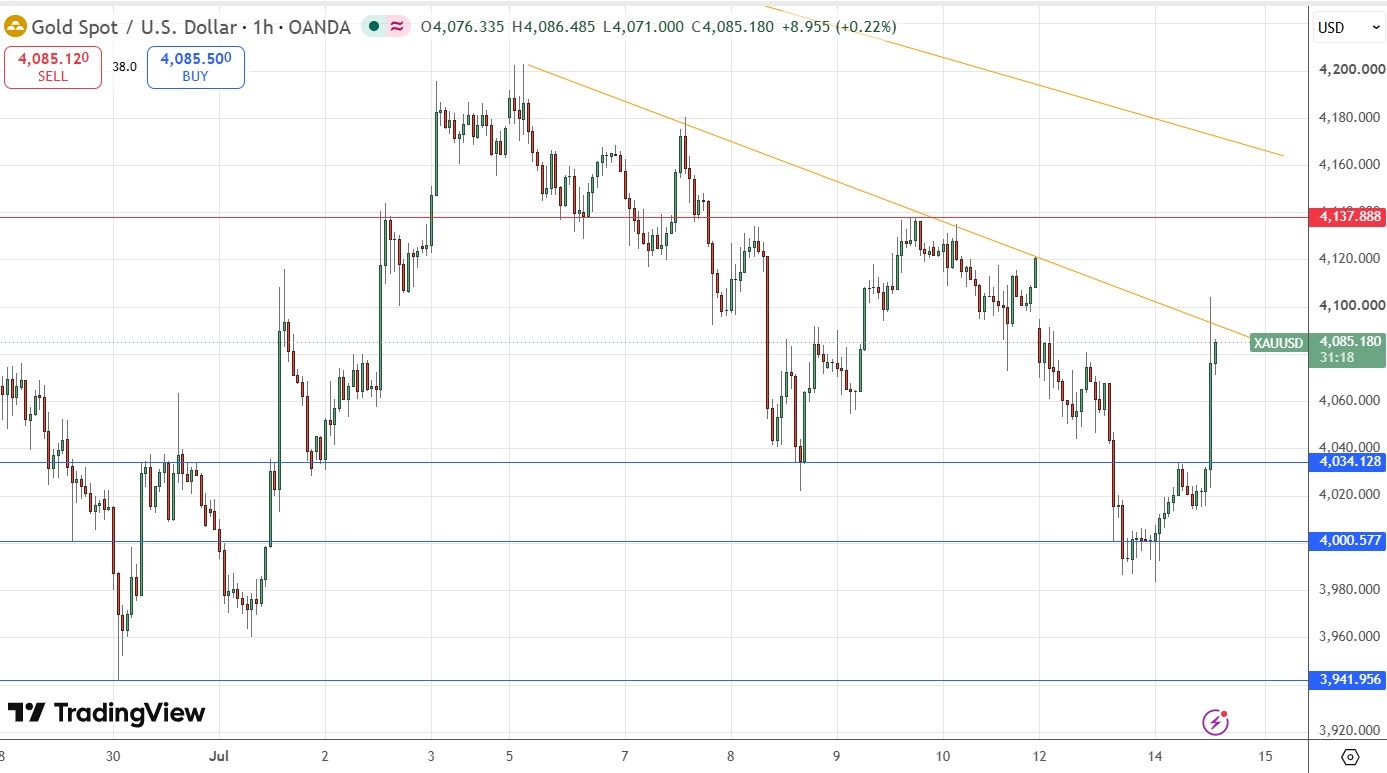
Gold H1 Price Chart
Technical Momentum, the Death Cross, and What They Really Show
The momentum profile over the last couple of months has clearly leaned to the downside, which fits the narrative of higher rates and a stronger US Dollar pressuring Gold. At the same time, recent pushback near support shows that buyers are not completely absent from the tape. The 50-day EMA crossing below the 200-day EMA has triggered the so-called death cross, a widely watched bearish signal among longer-term technical traders.
This indicator is often late, but its presence still matters because it shapes expectations for trend-followers and medium-term participants. If Gold were to break below $3,900, the death cross would appear to have “confirmed” a deeper downturn. On the other hand, a sustained move back above $4,000 and then toward the $4,200 region would begin to challenge that signal, especially if volume improves. The $4,200 area remains a key resistance zone that could answer many questions about whether buyers have enough conviction to change the story.
Middle East Risk and the Knife-Edge Nature of Gold’s Current Setup
Parallel to the data story, the Middle East remains an important source of uncertainty. The market is still hanging on a knife-edge, with each apparent step toward resolution followed by fresh flare-ups as neither side seems willing to budge decisively. That backdrop keeps energy prices, inflation expectations, and risk sentiment unstable, feeding into Gold’s role as both a potential hedge and a volatile trading asset.
In one scenario, a genuine easing of tensions could relieve some of the upward pressure on inflation expectations and give interest rate markets more room to normalize, which might take some support away from Gold at these levels. In another, a renewed escalation could combine with today’s softer CPI to create mixed signals: less immediate inflation pressure in the data but ongoing geopolitical reasons for investors to hold protection. That combination helps explain why Gold’s reaction to the CPI surprise, while sharp, still sits within a broader narrative of uncertainty rather than a clean new trend.
What Gold Traders Should Watch Next Around $4,000 and $4,100
For traders, the key near-term reference points are now clear. On the downside, $4,000 and then $3,900 remain the primary support levels that define whether this market is still in a controlled consolidation or slipping into a more aggressive selloff. On the upside, the intraday spike to $4,100 after the CPI release and the more established resistance around $4,200 outline the path any recovery attempt would need to follow.
As long as price continues to oscillate between these bands, the setup favors disciplined, range-aware strategies rather than chasing every move. The interplay between incoming data, interest rate expectations, and Middle East headlines will likely keep Gold on the edge of its recent range. Until one of these forces clearly dominates, traders will be navigating a market where support has held, but conviction on the next major leg remains unsettled.
Ready to trade our Gold analysis? Here is our list of the best Gold brokers worth reviewing.