


Bullish view
Buy the BTC/USD pair and set a take-profit at 70,000.
Add a stop-loss at 61,000.
Timeline: 1-2 days.
Bearish view
Sell the BTC/USD pair and set a take-profit at 61,000.
Add a stop-loss at 70,000.
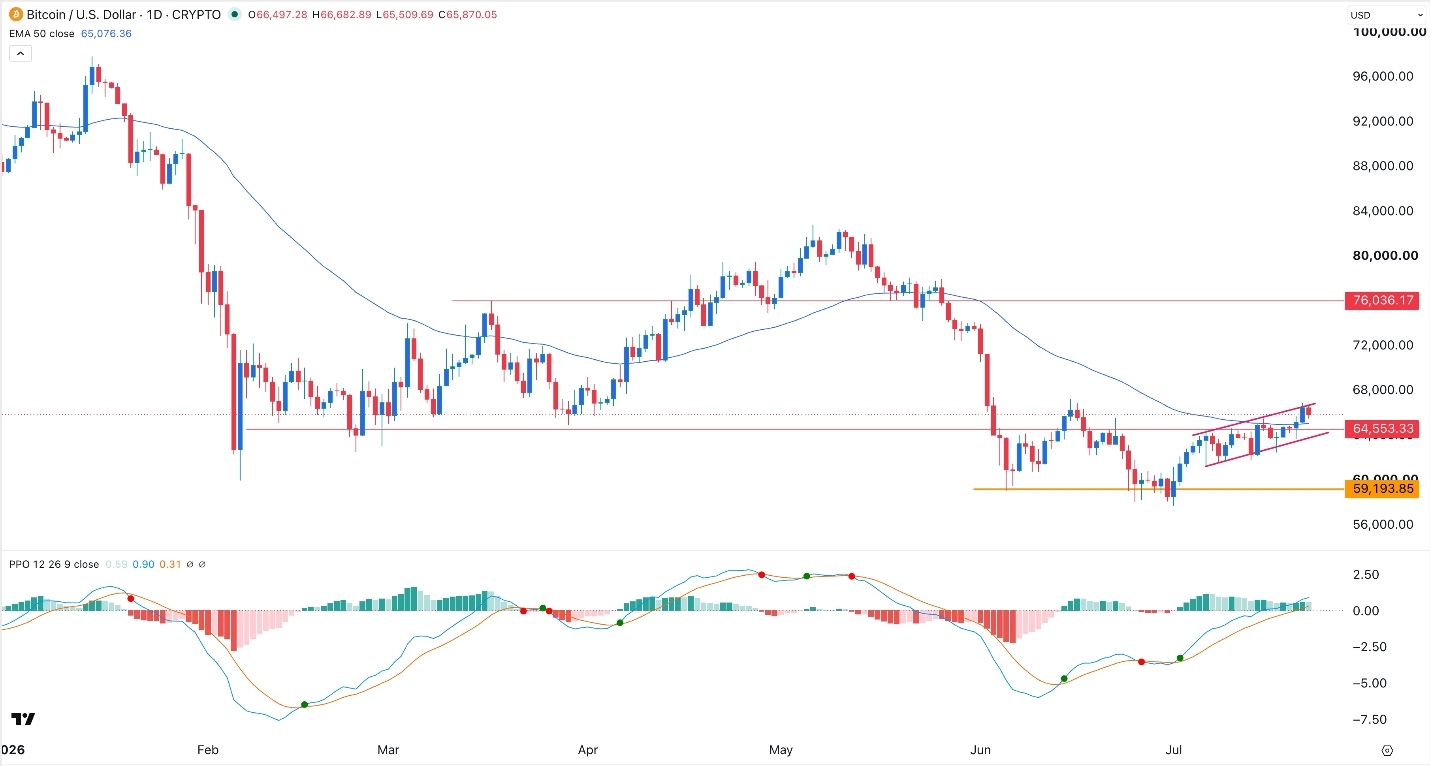
Bitcoin price came under pressure as geopolitical tensions intensified, pushing crude oil prices to their highest level since June 16. The BTC/USD pair was trading at 65,702 on Thursday morning, slightly below this week's high of 67,000, as investors adopted a more cautious stance amid rising uncertainty.
Bitcoin and other assets were little changed as the US and Iran continued their attacks. In Wall Street, the Dow Jones Index rose by just 40 points, while the Nasdaq 100 and S&P 500 indices retreated slightly.
Traders are worried about inflation as the US-Iran conflict continues. Brent and the West Texas Intermediate (WTI) benchmarks rose to $95 and $88, respectively.
Top Regulated Brokers
There is a risk that these prices will continue rising as the crisis in the Middle East intensifies. The US and Iran have continued their strikes and counterstrikes, with Trump warning that he will target key infrastructure projects near Tehran.
As a result, investors now anticipate that the Federal Reserve will hike interest rates by the end of the year. Odds of a hike have jumped to nearly 70%. Bitcoin and other altcoins normally underperform the market when the Fed is hiking rates.
On the positive side, there are signs that investors are starting to accumulate Bitcoin. Data shows that spot Bitcoin ETFs have added over $1 billion in assets in the last seven days. Including the outflows, Bitcoin ETFs have had net inflows of over $700 million this month. This is important because these funds had redemptions worth close to $7 billion in May and June.
Bitcoin has done well because of the recent actions by Strategy, the biggest digital asset treasury company in the world. The company has not sold any coins in the last two weeks. Additionally, there is a likelihood that the Senate will pass the CLARITY Act.
BTC/USD Technical Analysis
The daily chart shows that Bitcoin bottomed at $57,768 earlier this month as Strategy revealed its plan to start selling Bitcoin. Since then, it has staged a strong comeback and is comfortably above the resistance at 65,000.
Bitcoin has remained above the 50-day moving average, which has provided it with substantial support. Also, the two lines of the Percentage Price Oscillator (PPO) have continued rising and crossed the neutral line.
Therefore, the BTC/USD pair may continue rising in the near term as bulls target the key resistance level of 70,000. A drop below the 50-day moving average of 64,000 will invalidate the bullish view.
Ready to trade our free daily Forex trading signals? We’ve shortlisted the best MT4 crypto brokers in the industry for you.