


Bullish view
Buy the BTC/USD pair and set a take-profit at 70,000.
Add a stop-loss at 64,000.
Timeline: 1-2 days.
Bearish view
Sell the BTC/USD pair and set a take-profit at 64,000.
Add a stop-loss at 70,000.
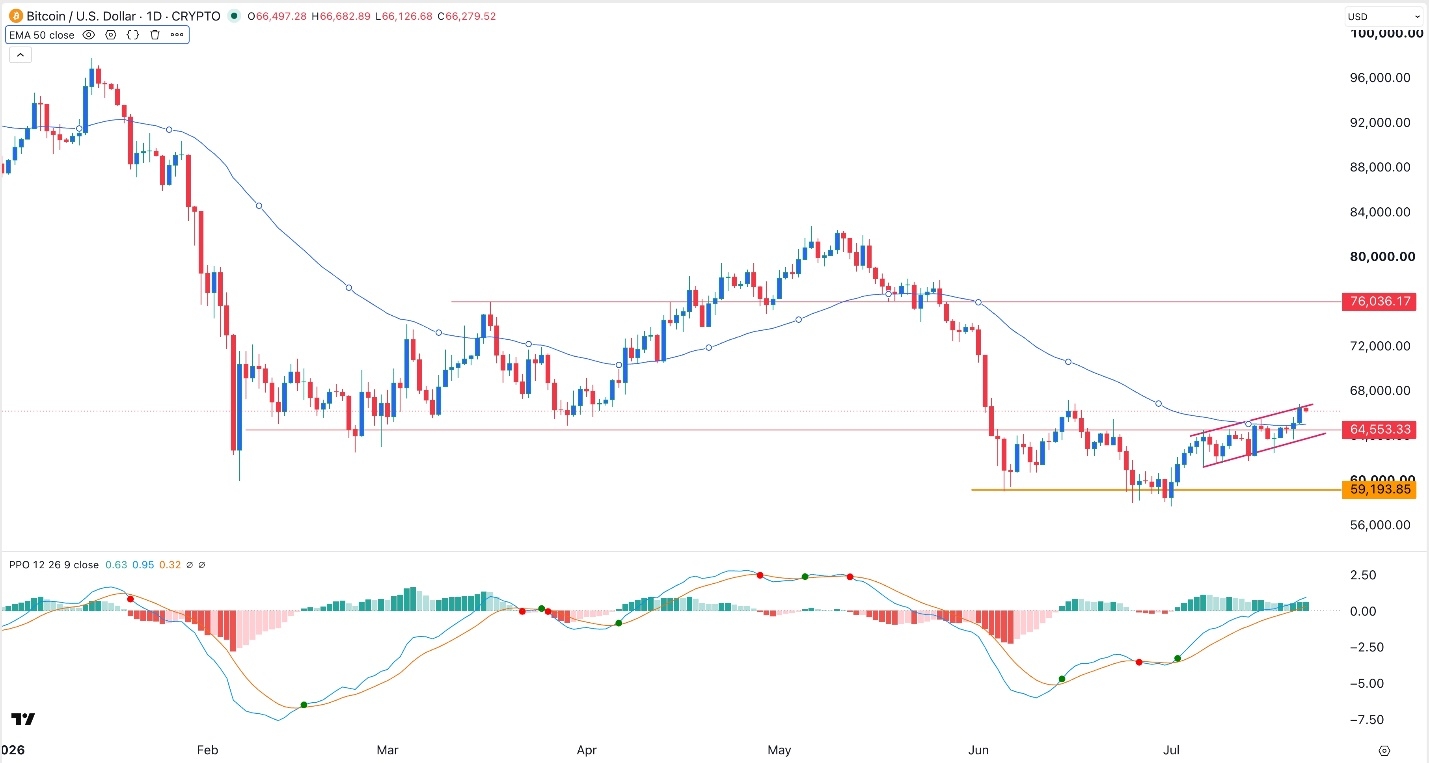
Bitcoin price held steady and moved above the key resistance level of $66,000 as investors continued buying the dip. The BTC/USD pair jumped to 66,900, its highest level in over a month. It has jumped by nearly 15% from the lowest level this year.
Top Regulated Brokers
Bitcoin Price Jumps Amid ETF Accumulation
The BTC/USD pair has moved sideways in the past few days, helped by the ongoing accumulation by American investors. Data shows that spot Bitcoin ETFs have had close to $1 billion in assets in the last five consecutive days. These funds have now added over $500 million this month, a sign that demand among investors is rising.
This is notable because it is happening at a time when the stock market has become highly volatile, with some of the best-performing companies sliding into a bear market. As such, there is a likelihood that investors are rotating from the stock market to cryptocurrencies.
The BTC/USD pair has also jumped as the futures open interest continued rising. Data shows that its 24-hour futures open interest has jumped to over $48 billion from this month’s low of $45 billion.
The rising demand has pushed its supply in exchanges to 2.48 million from this year’s high of 2.5 million. That is a sign that demand is still there even as it remains in a bear market.
Bitcoin’s rally also happened as investors embraced a risk-on sentiment, with the stock market resuming its comeback. The Dow Jones Index soared by 370 points, while the Nasdaq 100 jumped by 325 points, even as the US-Iran war escalated, with the two sides launching strikes overnight.
BTC/USD Technical Analysis
The daily chart shows that the BTC/USD pair has been in an uptrend in the past few weeks. It has jumped from the year-to-date low of 57,768 to the current 66,353.
The pair has already flipped the 50-day moving average from a resistance level into support. At the same time, the Stochastic Oscillator and other momentum indicators have continued rising in the past few weeks. It has also formed an inverted head-and-shoulders pattern.
Therefore, the pair will likely continue rising as bulls target the key resistance at 70,000. A drop below the key support level of 65,000 will point to more downside, potentially to 60,000.
Ready to trade our free Forex signals? Here are the best MT4 crypto brokers to choose from.