


Bullish view
Buy the BTC/USD pair and set a take-profit at 67,000.
Add a stop-loss at 60,000.
Timeline: 1-2 days.
Bearish view
Sell the BTC/USD pair and set a take-profit at 60,000.
Add a stop-loss at 67,000.
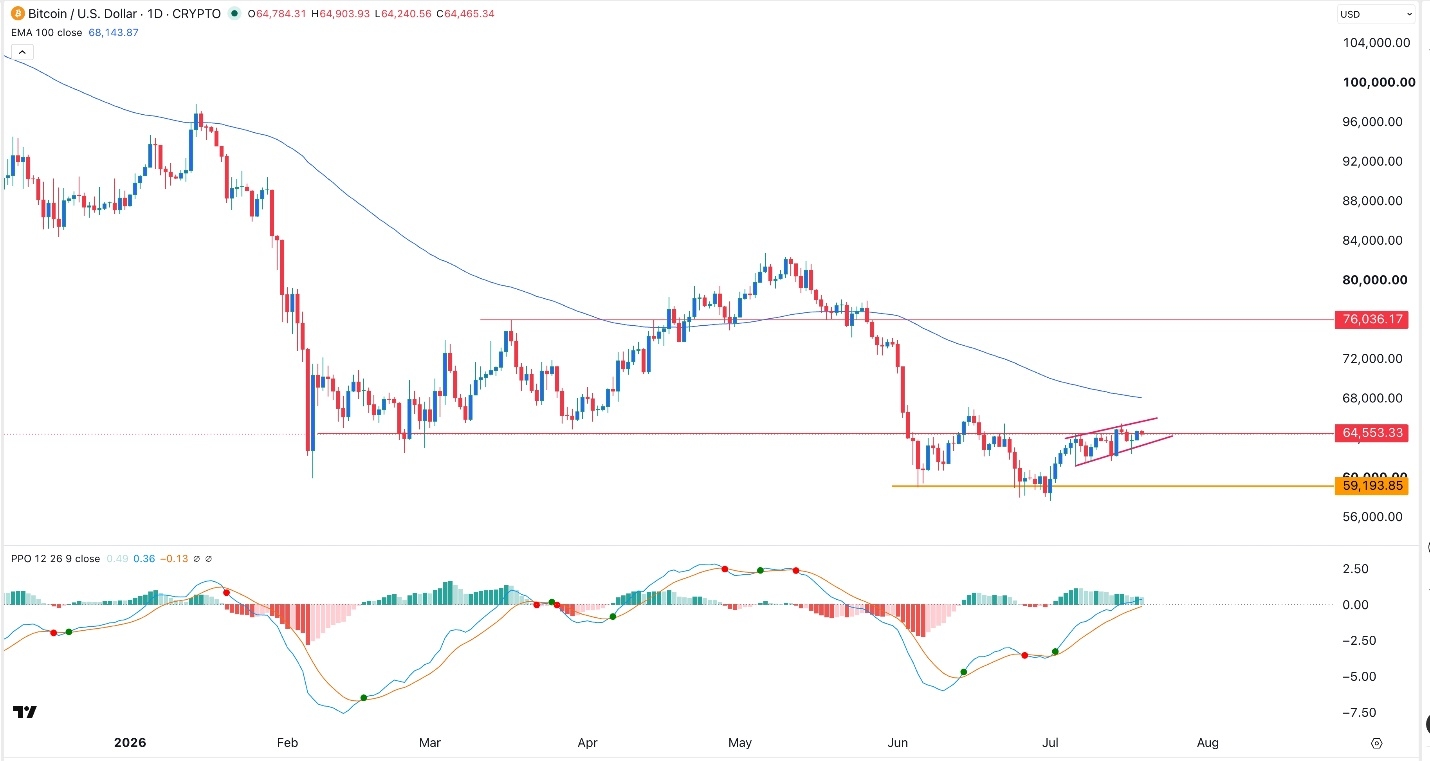
Bitcoin price has stabilized above the important support of $64,000 as demand from American investors rose despite the rising geopolitical risks. The BTC/USD pair was trading at 64,670, inside a range it has remained in the past few days.
Top Regulated Brokers
Bitcoin ETF Inflows are Rising as Investors Focus on Strategy
The BTC/USD pair has remained in a tight range, even as geopolitical and macro risks rose. The US and Iran have resumed their kinetic activity, boosting crude oil prices.
There are now concerns that this is turning into a forever war that may push crude oil prices higher in the long term. For one, there is a risk that Houthis and Iranians will shut down the Red Sea. Also, Iran has warned that it will attack Fujairah, a major port in the United Arab Emirates. This explains why crude oil prices are in a strong uptrend.
Rising oil prices means that US inflation will resume rising after falling in June. Two reports released last week showed that the headline Consumer Price Index (CPI) dropped to 3.5% in June, while the Producer Price Index (PPI) fell to 5.5%. Higher inflation means that the Federal Reserve will likely hike interest rates.
The BTC/USD pair also reacted to the elevated ETF inflows. Data shows that these funds added assets in the last four consecutive days. They added $500 million in the last four days, bringing the cumulative net inflows to $51 billion.
The next key catalyst to watch will be the upcoming statement from Strategy, which will announce its actions last week. The company has been selling some of its coins as it raises cash to boost its balance sheet. It has already sold coins worth over $200 million.
BTC/USD Technical Analysis
The daily chart shows that the BTC/USD pair has remained inside a narrow range in the past few weeks. It has formed an ascending channel, and is slowly nearing the upper side. The coin formed a doji candlestick pattern last week, pointing to more gains in the near term.
At the same time, the two lines of the Percentage Price Oscillator (PPO) have continued rising and crossed the upper side of the zero line. Therefore, the pair will likely continue rising as bulls target the key resistance at 67,000. A drop below the lower side of the channel will point to more downside.
Ready to trade our free Forex signals? Here are the best MT4 crypto brokers to choose from.