


Bearish view
Top Regulated Brokers
Sell the BTC/USD pair and set a take-profit at 60,000.
Add a stop-loss at 67,000.
Timeline: 1-2 days.
Bullish view
Buy the BTC/USD pair and set a take-profit at 67,000.
Add a stop-loss at 60,000.
Bitcoin's price has remained within a narrow range this week as investors focus on rising ETF outflows and a hawkish Federal Reserve. The BTC/USD pair was trading at 63,884 on Thursday, a few points above this month’s low of 57,655.
Bitcoin ETF Outflows and Federal Reserve Decision
The BTC/USD pair was stuck in a narrow range after the Federal Reserve delivered its July interest rate decision. As most economists were expecting, the bank decided to leave interest rates unchanged as it has done this year.
The main change in this meeting is that some officials are pushing back. Three of them voted to increase interest rates by 0.25% at this meeting, citing elevated near-term consumer inflation.
The US and Iran have resumed their strikes this week, pushing crude oil prices higher. Brent jumped to $87, while the West Texas Intermediate (WTI) jumped to $84, and this trend will likely continue. Gasoline prices have moved above $4. These metrics explain why US stock indices plunged, with the Dow Jones and S&P 500 falling by 1.5% and 0.80%.
Meanwhile, demand for Bitcoin among American investors has continued falling this month. Data shows that these funds have shed over $500 million in assets in the last five consecutive days. As a result, the monthly inflows have dropped to below $150 million.
More data shows that Bitcoin’s futures open interest has started falling in the past few days, a sign that demand in the market has stalled. It dropped to $47 billion from this month’s high of $51 billion.
BTC/USD Technical Analysis
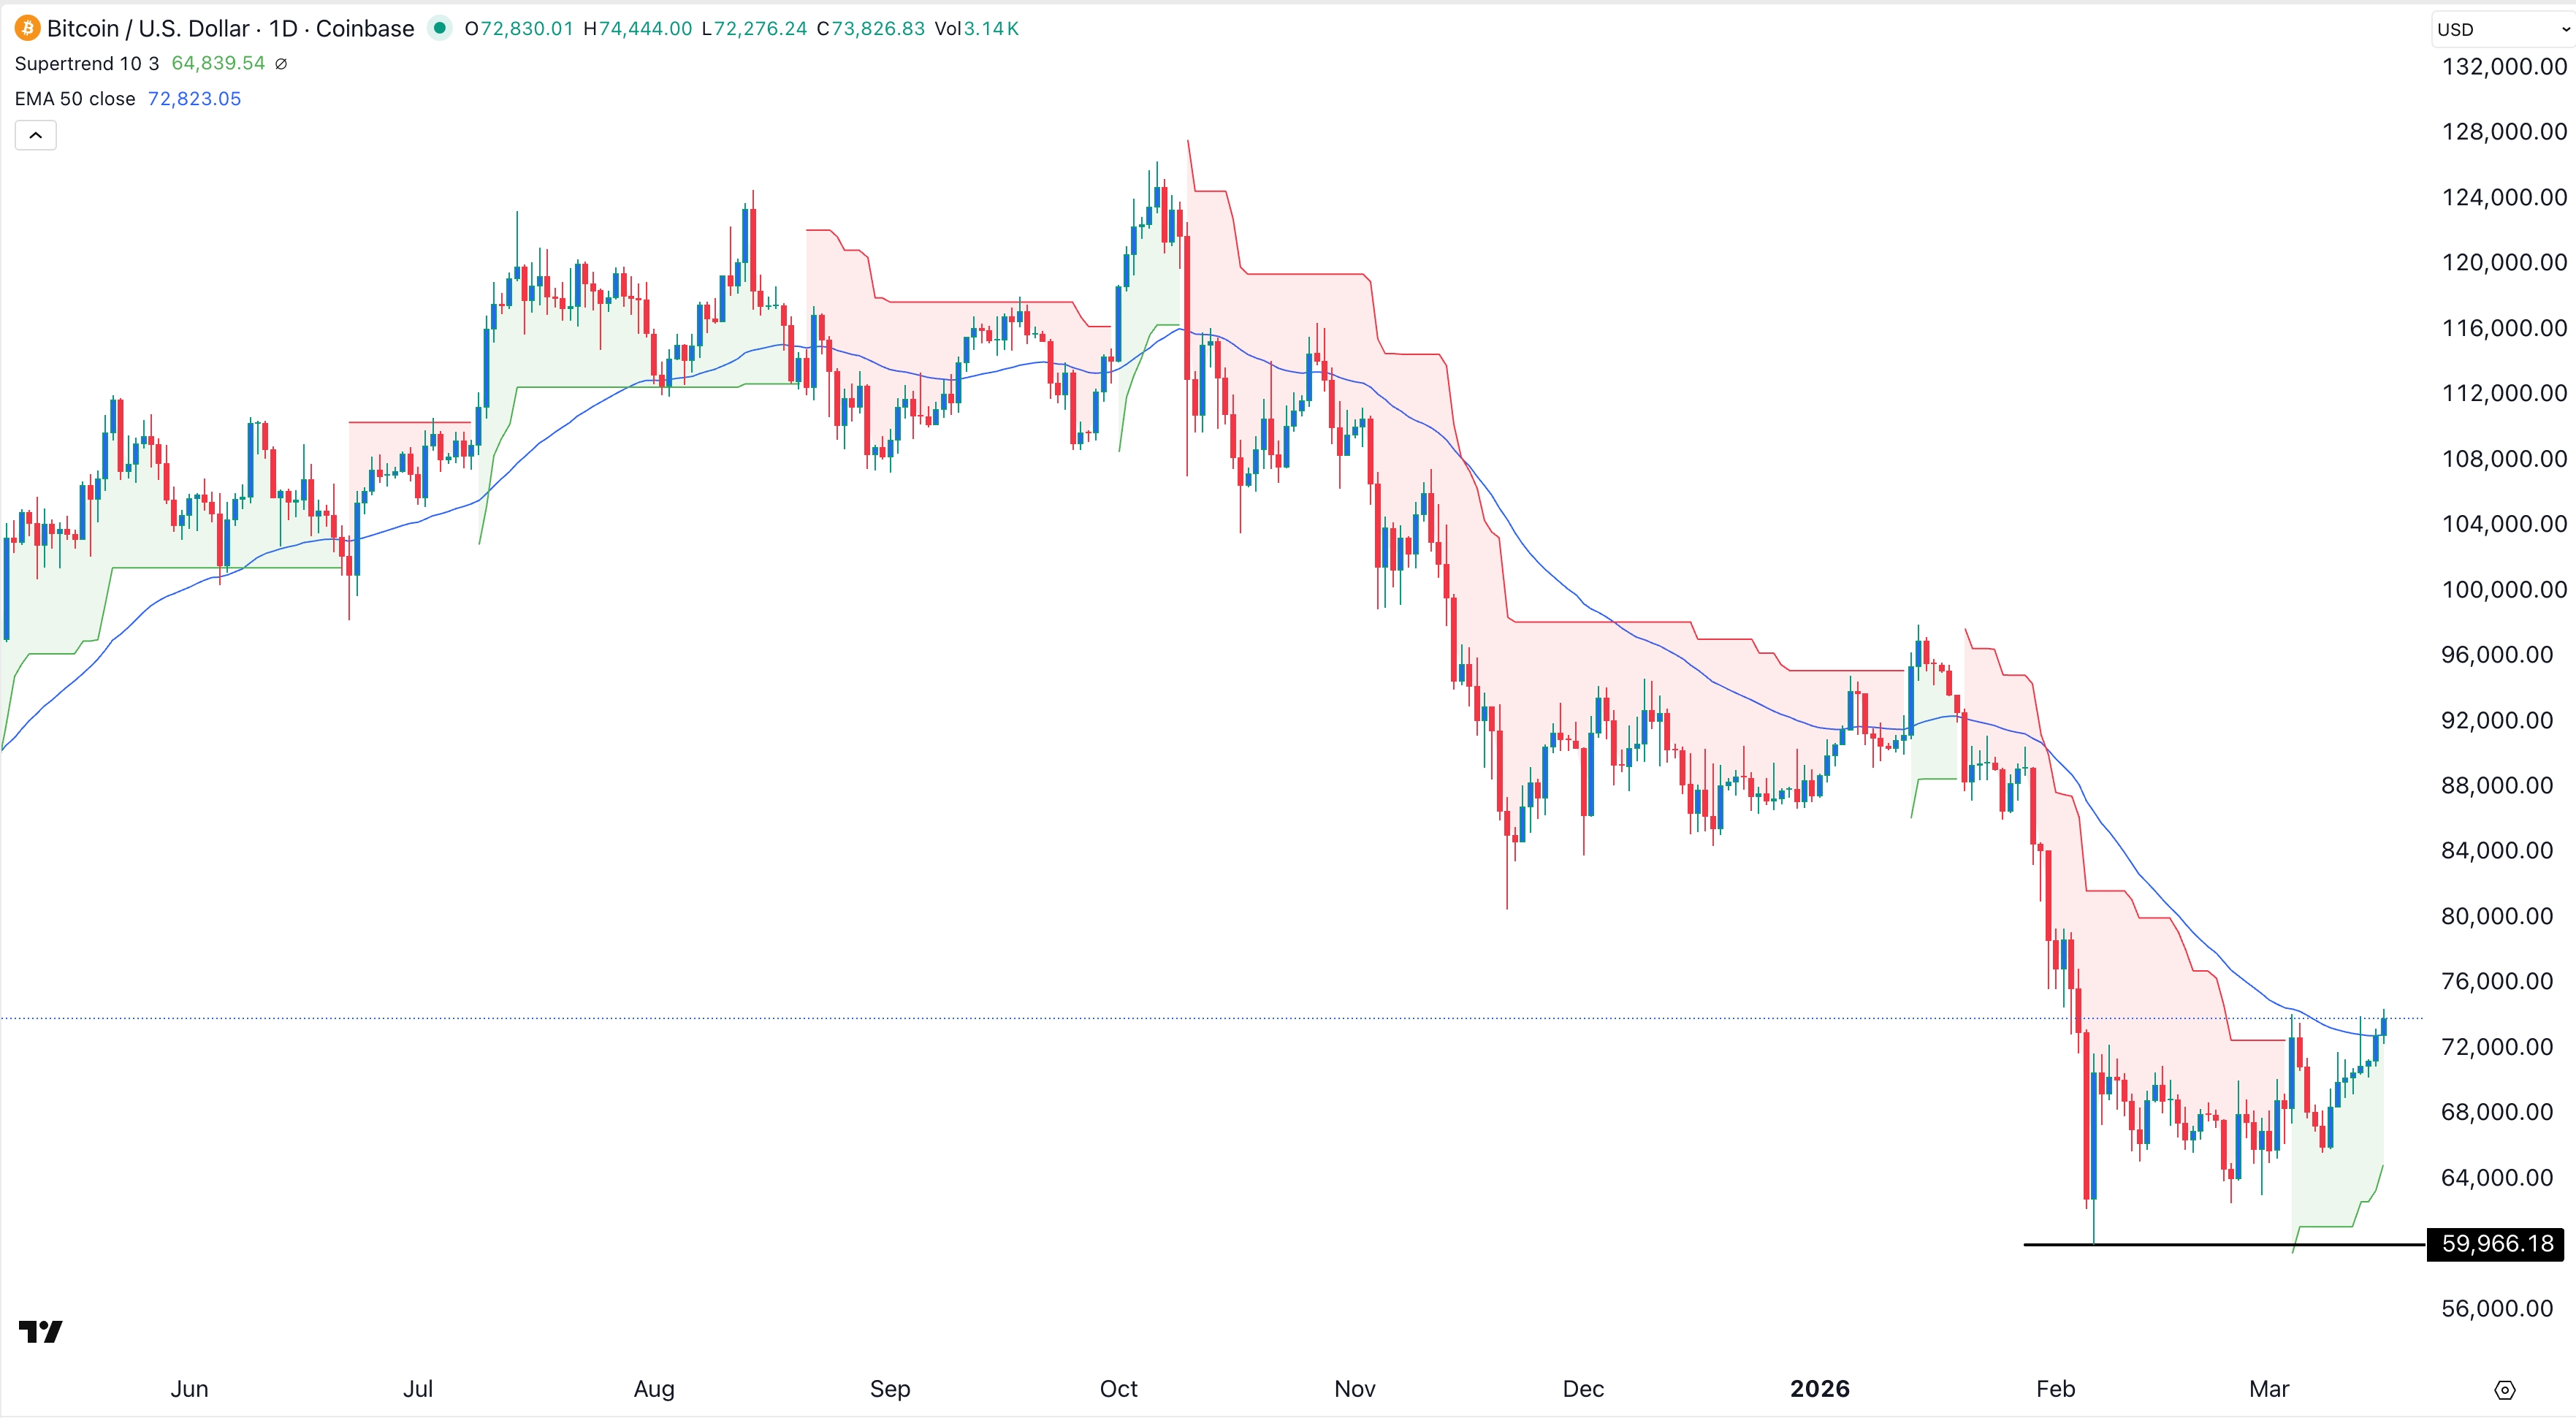
The daily chart shows that the BTC/USD pair has moved sideways in the past few days, moving from 66,700 to the current 63,945. It has moved slightly below the 50-day Exponential Moving Average (EMA). The Relative Strength Index (RSI) has slumped below the neutral level of 50. Its volume has also continued falling in the past few days.
Therefore, while Bitcoin has moved sideways, it remains in a long-term downward trend. Therefore, the BTC/USD pair will likely continue falling in the near term, with the next key target to watch being the psychological level of 60,000. On the other hand, a move above the key resistance level of 66,700 will invalidate the bearish outlook.