


Bitcoin (BTC) dropped below $64,000 during the early Asian trading hours on Monday, as the impacts of the fourth round of US strikes on Iran hit the market. This comes amid renewed institutional demand for spot Bitcoin ETFs, raising questions whether BTC price will reclaim the $64,000 level if the inflows continue this week.
Bitcoin Slips From $64K as War Sell-Off Hits Markets
The fourth round of U.S. strikes on Iran landed early Monday, and the reaction unfolded where geopolitical risk usually shows up first — in oil, gold and crypto.
Bitcoin, the largest cryptocurrency by market capitalization, led the sell-off in the crypto sector, dropping as much as 3% from $64,320 to as low as $62,460. Ether (ETH), the largest altcoin, barely moved with a 0.7% drop over the last 24 hours to trade just below $1,800. Other top-cap also saw small to modest losses, as shown in the figure below.
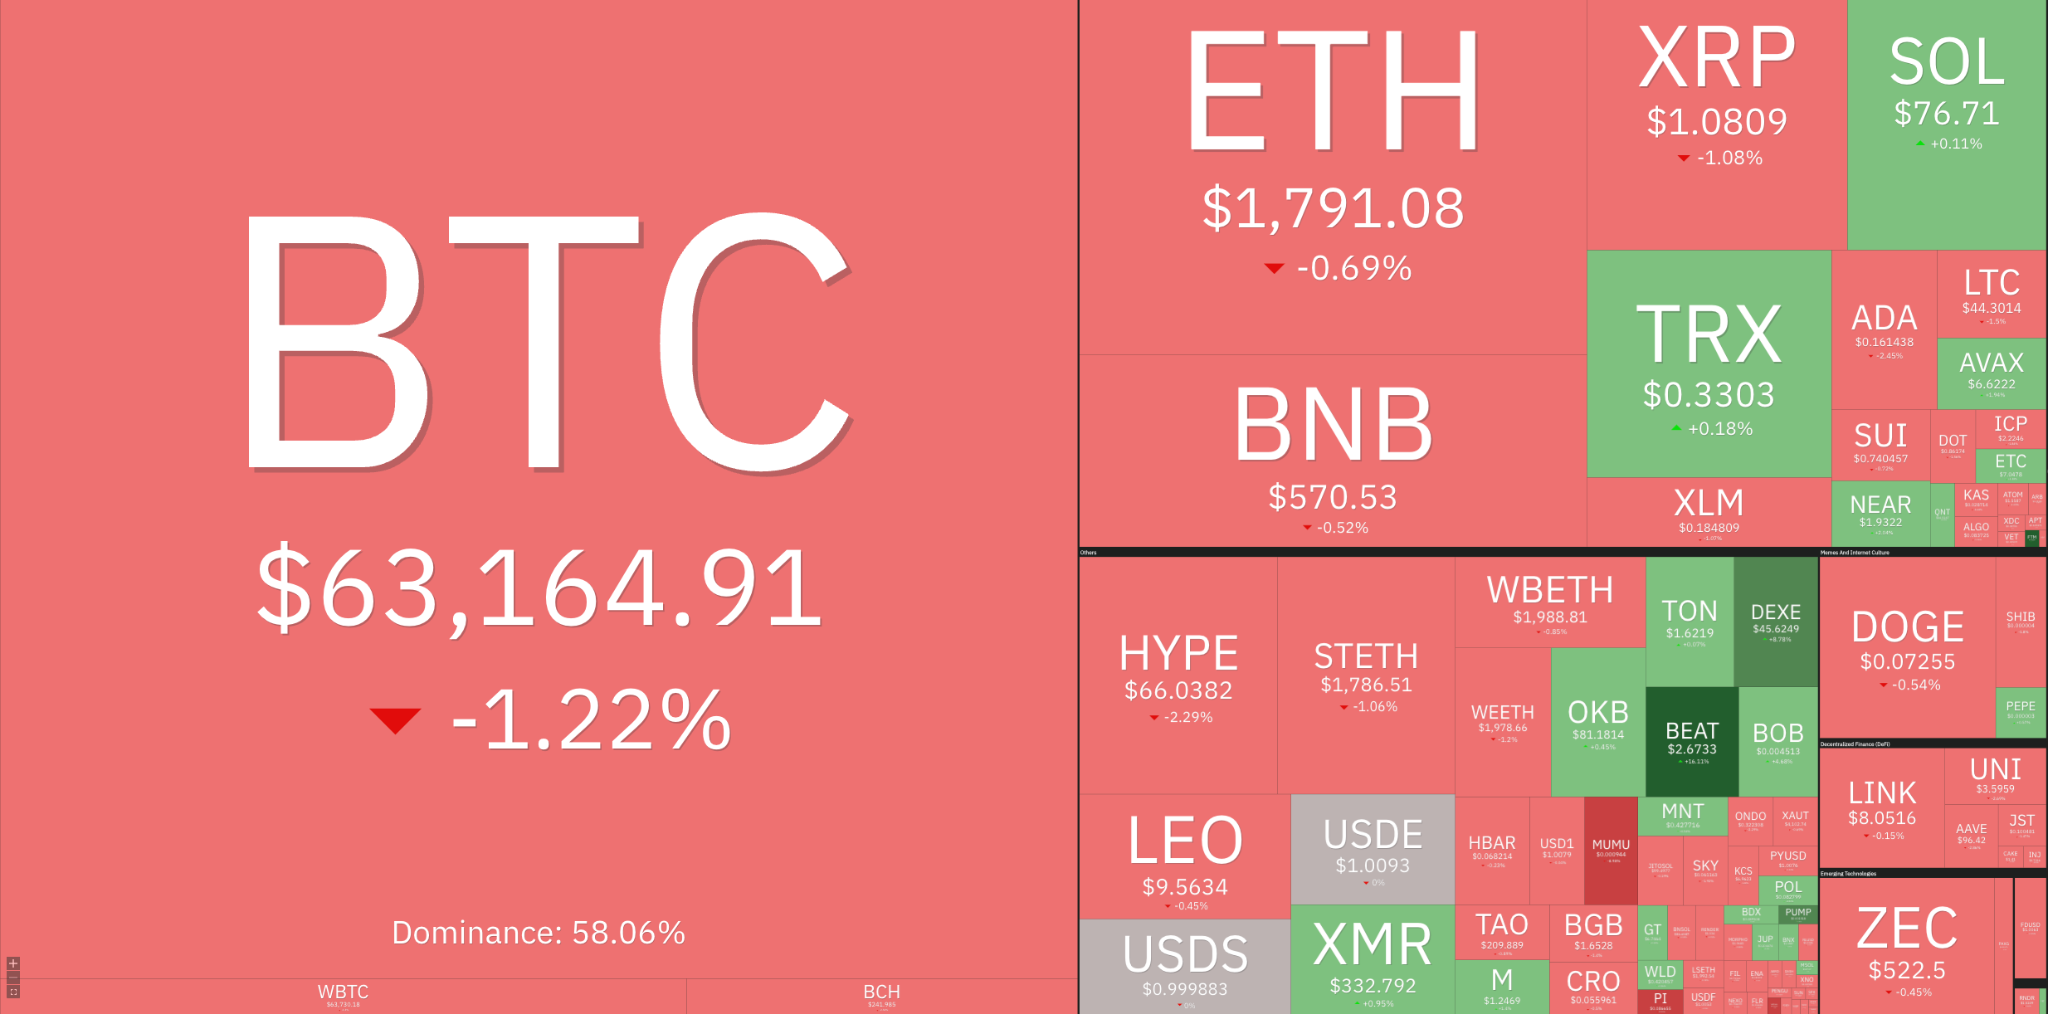
24-hour performance of top-cap cryptocurrencies. Source: Coin360
This drop was followed by the liquidation of more than $250 million of leverage positions, with $195 million in longs, according to data from CoinGlass. Bitcoin accounted for $70 million of these liquidations, with $60 million representing BTC longs.
Gold, oil, equities and bonds all reacted sharply to the strikes on Iranian targets. WTI crude and Brent both extended their losses on fears that a wider conflict could disrupt the Strait of Hormuz, a corridor carrying roughly 20% of global oil supply per day.
Top Regulated Brokers
Gold and Treasuries fell together, reflecting the same fear: oil-driven inflation forcing the Fed to hold rates higher for longer, which lifts real yields and dulls the appeal of both.
Equities sold off broadly, a move amplified by a separate rout in Korean chip stocks after SK Hynix's newly listed US shares reversed sharply.
“Geopolitics playing up again over the last few days,” popular crypto analyst Daan Crypto Trades said in an X post on Monday, adding:
“Bitcoin remains rangebound between this ~$61K-$65K region and is right in the middle here.”
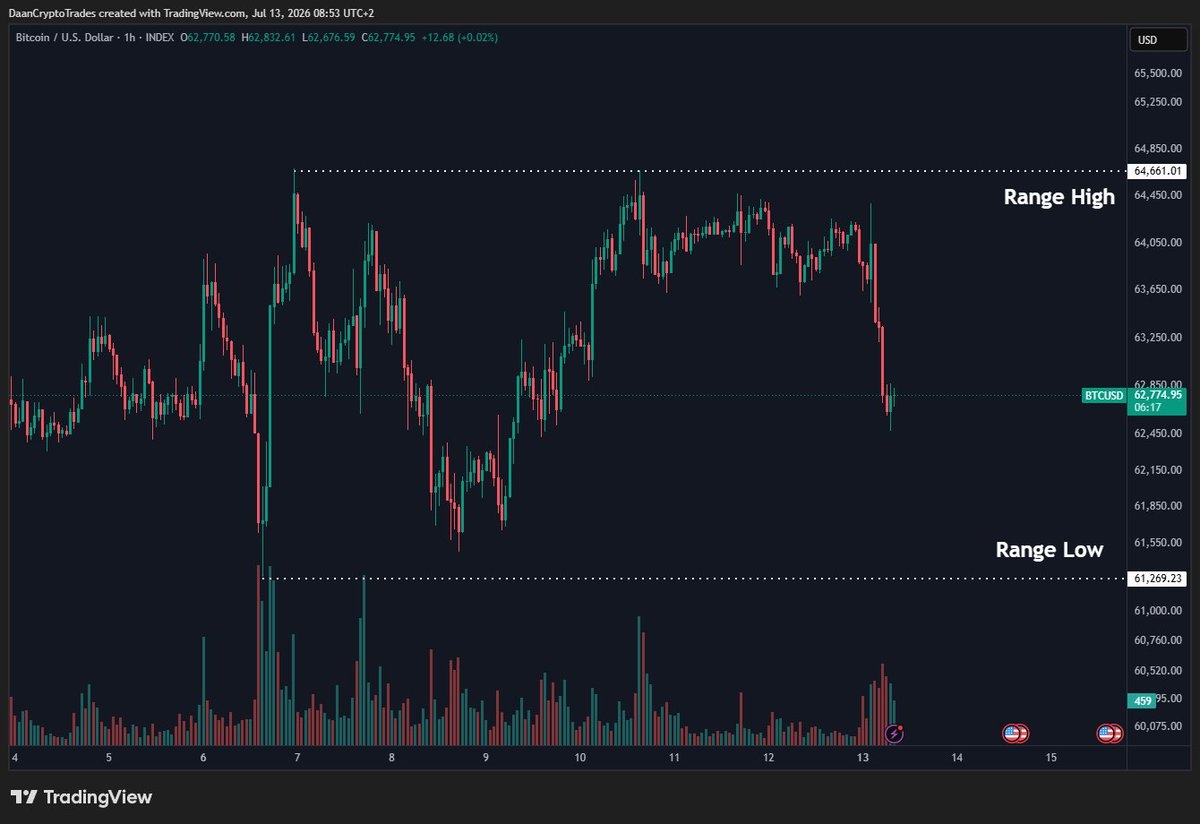
BTC/USD 1-hour chart. Source: Daan Crypto Trades
Bitcoin Price Needs to Reclaim $64,000 to Secure the Uptrend
From a technical perspective, Bitcoin’s bullishness hinges on reclaiming the $64,000 level, where the 50-day simple moving average (SMA) sits.
Note that this is a stiff level of resistance that has rejected every rally attempt since early June.
Overcoming this resistance would open the way for a rise toward the $67,250 range high, reached on June 15. Higher than that, the next logical move would be toward the $70,000 psychological level, about 11% from the current price.
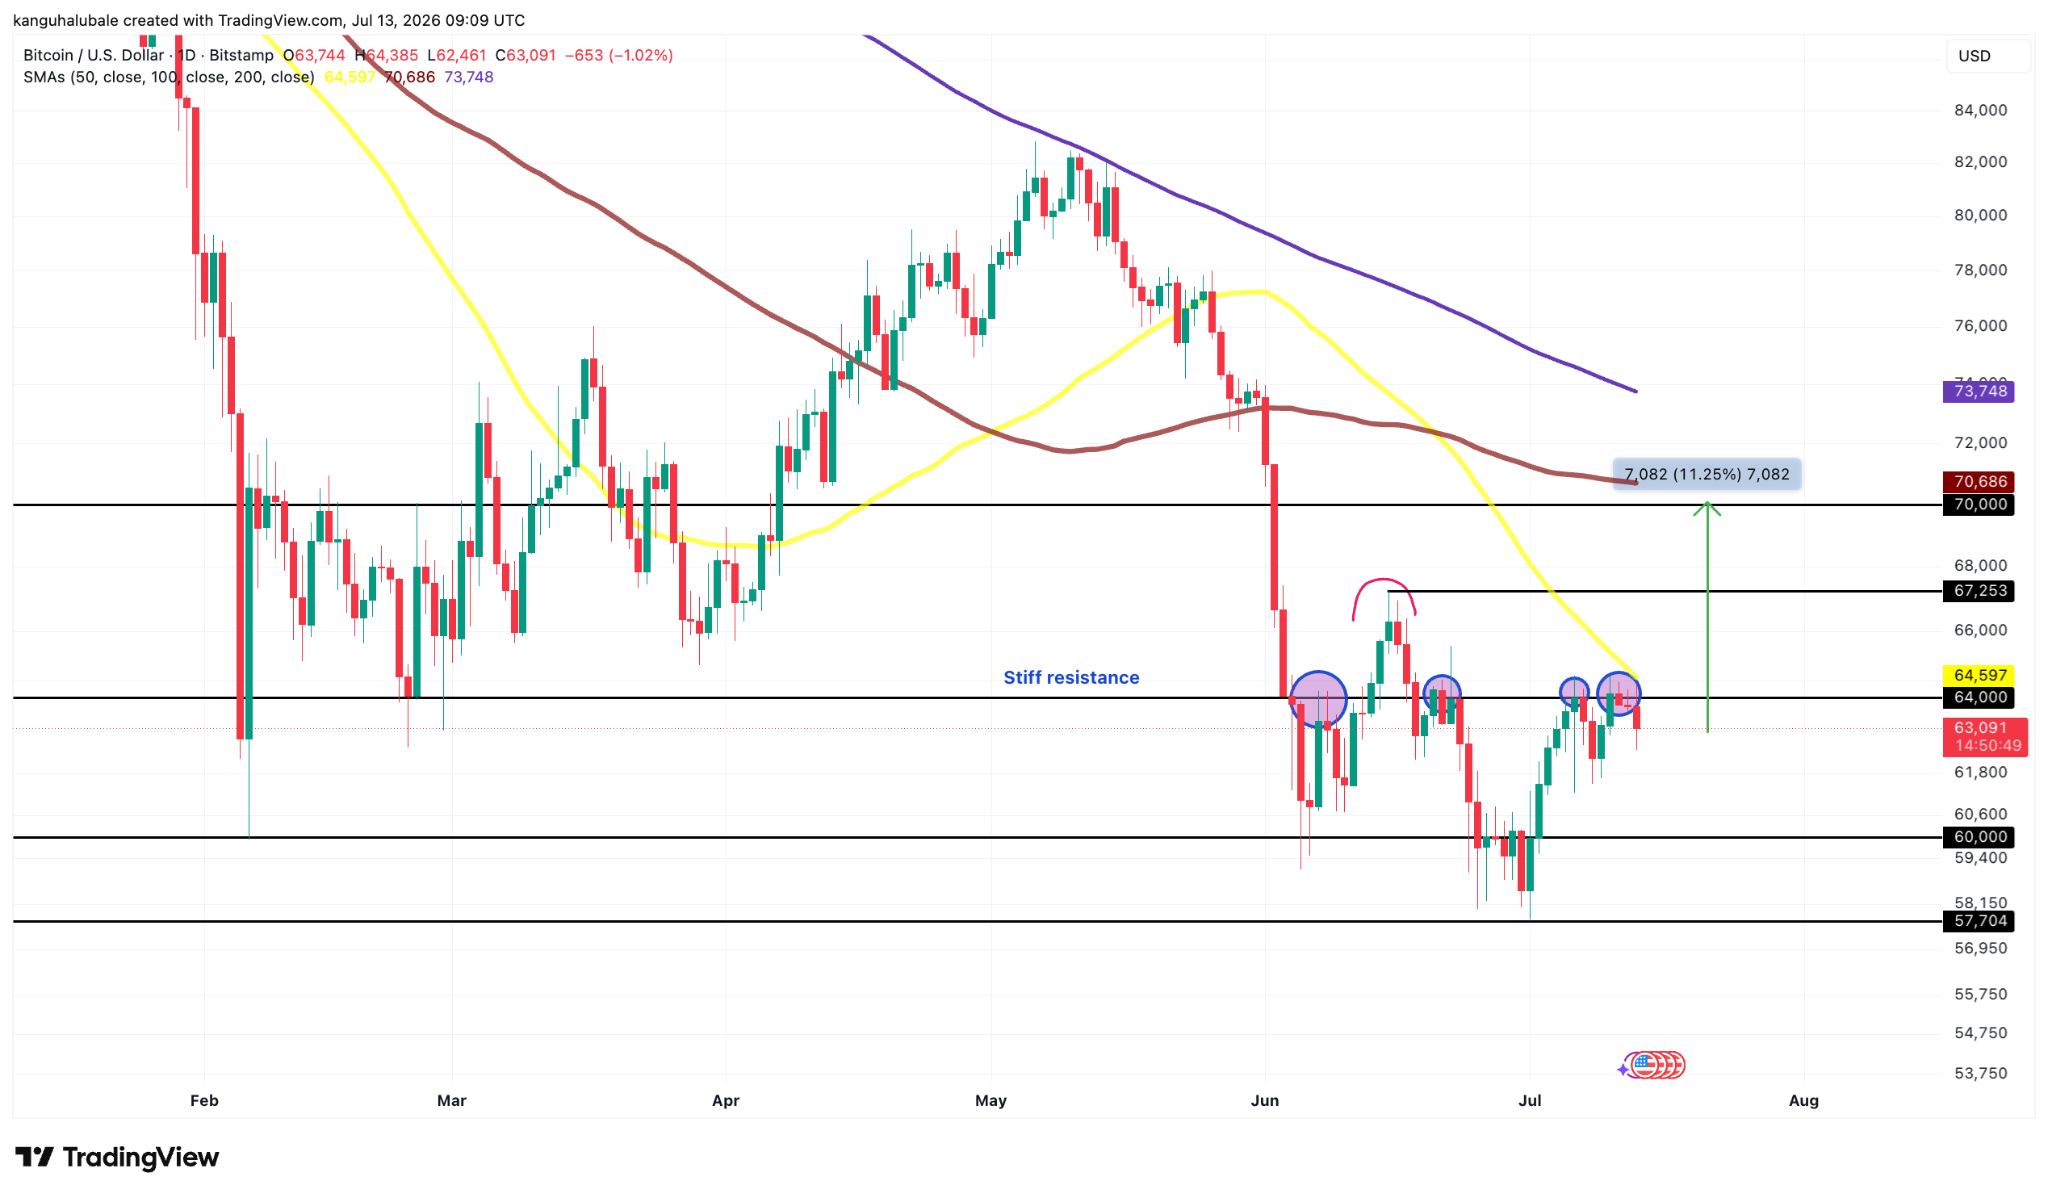
BTC/USD daily chart. Source: TradingView
Analyst Michaël van de Poppe flagged this zone after Bitcoin was rejected there in mid-June, saying that price could breakout over the next few days or weeks as long as the 21-day moving average at $61,000 holds as support.
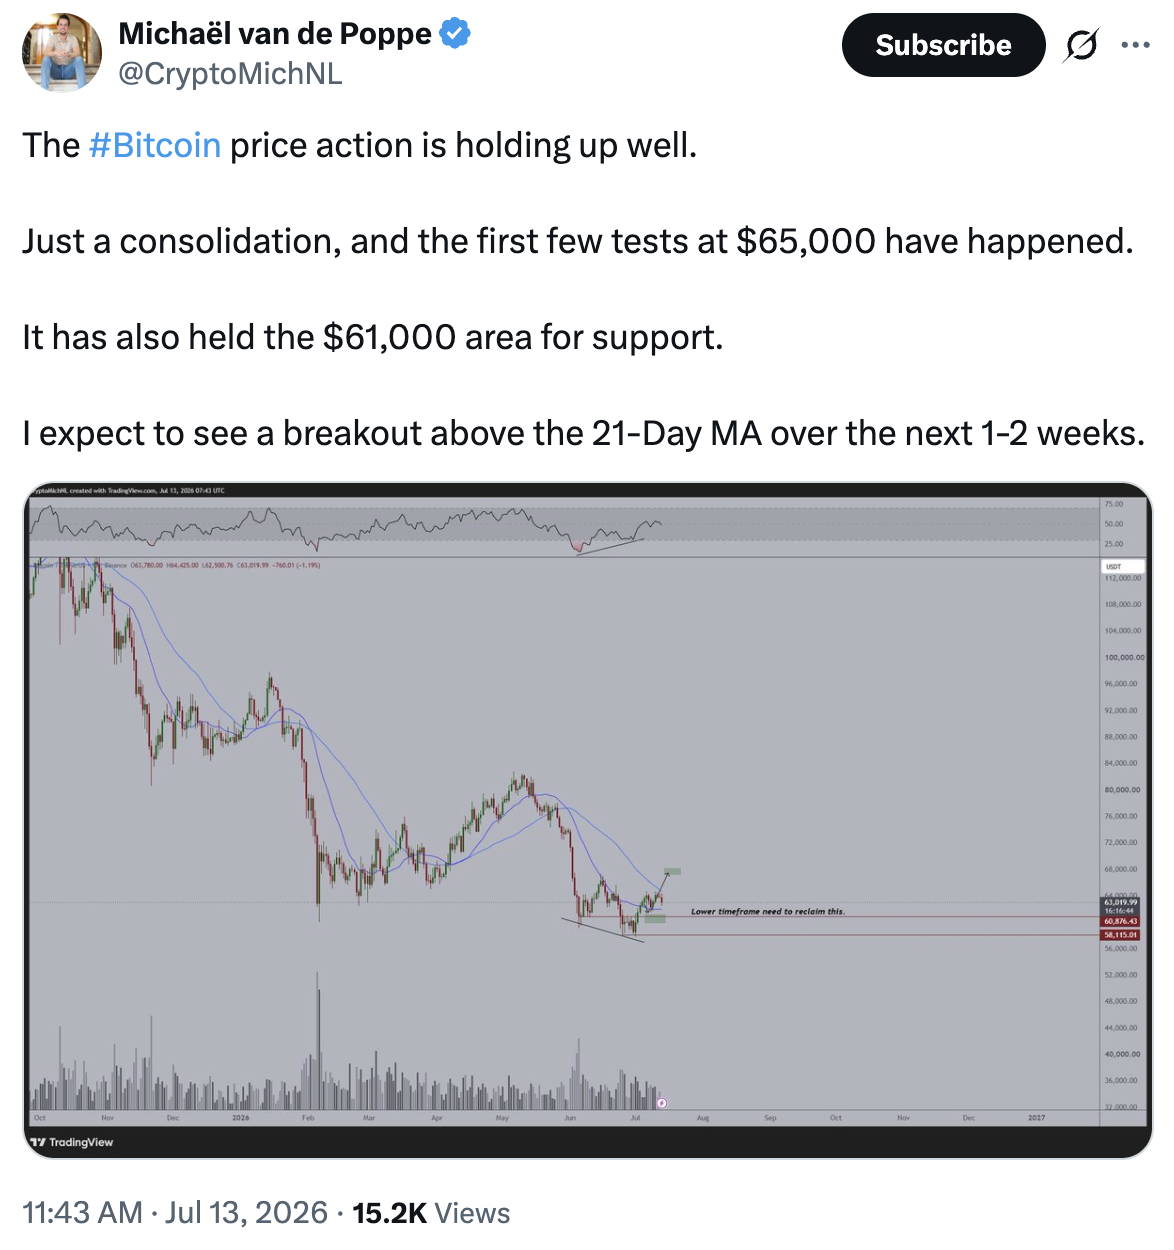
Source: Michael van de Poppe
On the downside, a weekly close below $60,000 would bring the mid-$50,000s into the picture.
Bitcoin ETFs Snap 8-Week Outflow Streak With $197 Million in Flows
Institutional flows offered the week's one clear improvement. US-listed spot Bitcoin ETFs recorded a net inflow of $197.4 million during the week ending July 10, snapping an eight-week outflow streak dating back to May — the longest losing run since the funds launched in January 2024, according to data from SoSoValue.
BlackRock's iShares Bitcoin Trust did the heavy lifting with $291.9 million, partly offset by redemptions from Grayscale, Fidelity's Wise Origin fund and ARK 21Shares. Spot Ether ETFs mirrored the move, ending their own eight-week outflow run with $84.4 million in inflows.
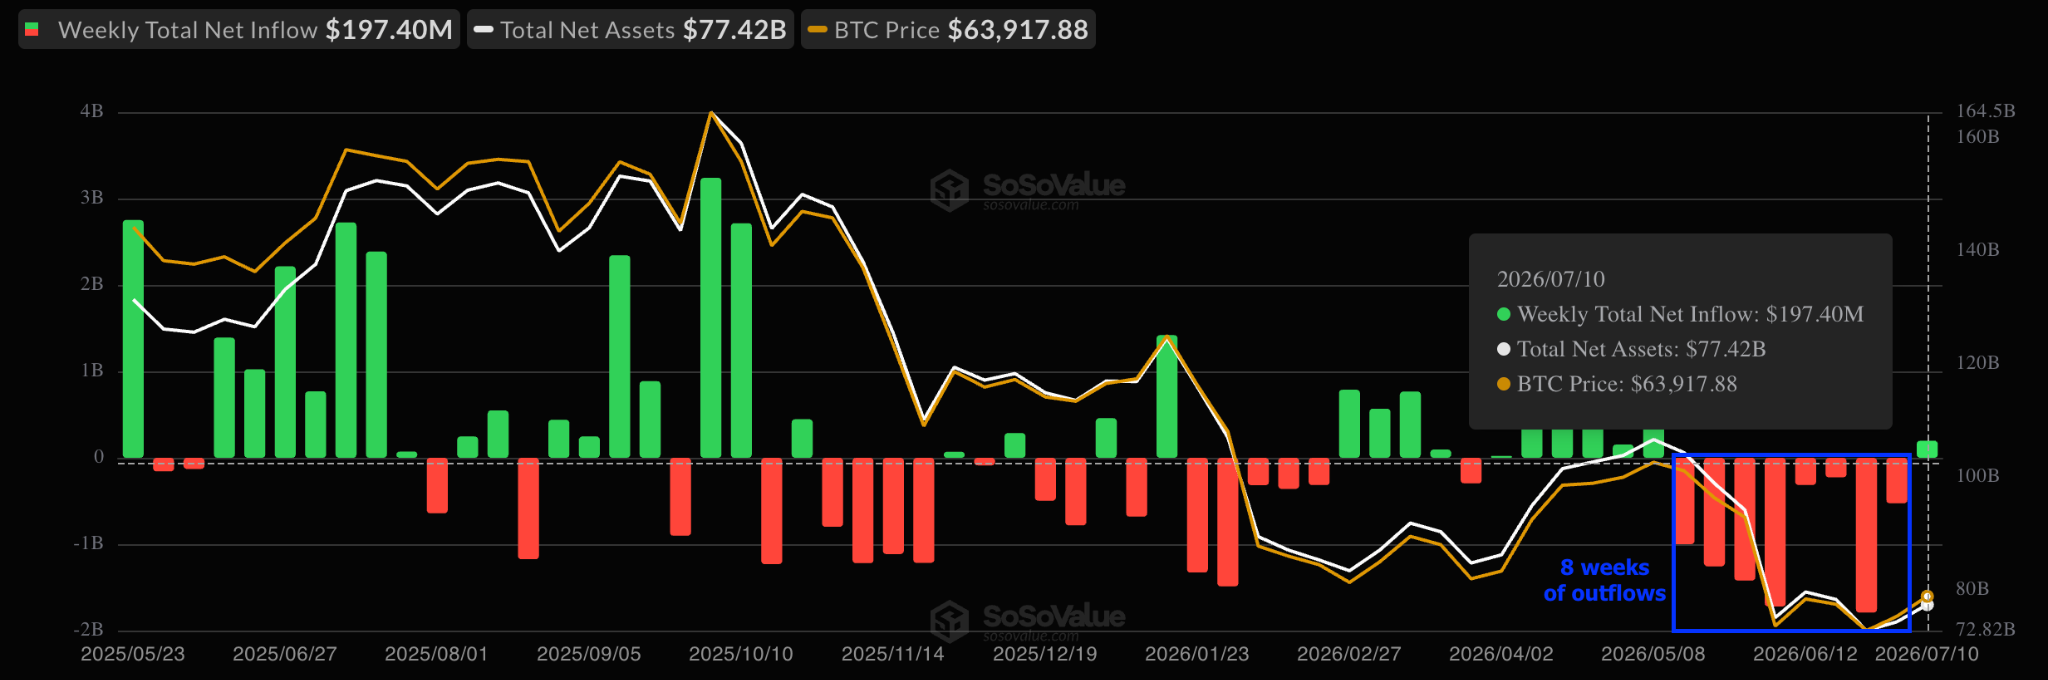
Spot Bitcoin ETFs flows chart. Source: SoSoValue
Analysts aren't yet calling this an institutional demand recovery, and the reasoning is largely arithmetic: the prior eight weeks drained roughly $8.26 billion from Bitcoin ETFs alone, so last week's inflow recovered only about 2–3% of what exited. One research firm called it the end of the heaviest ETF distribution wave of the downturn, but stopped short of a reversal call, and others point to seasonally softer flows in August and September as reason for caution.
With the July US CPI report inflation report due this week, a second consecutive week of inflows - not this one alone - is the signal to watch.
Ready to trade our analysis of Bitcoin? Here’s our list of the best MT4 crypto brokers worth checking out.