


Bearish view
Top Regulated Brokers
Sell the AUD/USD pair and set a take-profit at 0.6865.
Add a stop-loss at 0.7027.
Timeline: 1-2 days.
Bullish view
Buy the AUD/USD pair and set a take-profit at 0.7027.
Add a stop-loss at 0.6865.
The AUD/USD exchange rate dropped in the last three consecutive days, reaching its lowest level since July 14, down modestly from this month’s high of 0.7027. This retreat may continue after the recent Australian inflation data.
Australia Inflation and US-Iran War
The AUD/USD pair retreated after Australia published the latest consumer inflation data. A report by the Australian Bureau of Statistics (ABS) showed that the headline consumer inflation dropped from 4.1% in the first quarter to 3.9% in Q2. This retreat was lower than the expected of 4.1%.
The trimmed-mean inflation came in at 3.6%, lower than the expected 3.7%, while the weighted mean figure was 3.6%. Most notably, in June, the headline inflation dropped from 4.0% in May to 3.80% in June, also lower than the expected 4.0%.
These numbers mean that the Reserve Bank of Australia (RBA) may delay interest rate hikes in the coming meetings. Nonetheless, despite the soft inflation data, it remains above the bank’s target of 2%, meaning that the fourth rate hike cannot be ruled out.
The report came a week after the ABS released the latest jobs numbers, which showed that the economy created more than 70k jobs in June, after adding 48k in the previous month.
The AUD/USD pair retreated after Iran launched a surprise attack against the US in Jordan, even as Trump said that the two sides were in talks. This means that the US will likely respond by launching its own attacks against Iran. As a result, Brent and the West Texas Intermediate (WTI) rose to $82, while Brent jumped to $85.
The next important catalyst for the pair will be the July Federal Reserve interest rate decision. Economists expect Kevin Warsh and the team to leave interest rates unchanged, but maintain a hawkish outlook.
AUD/USD Technical Analysis
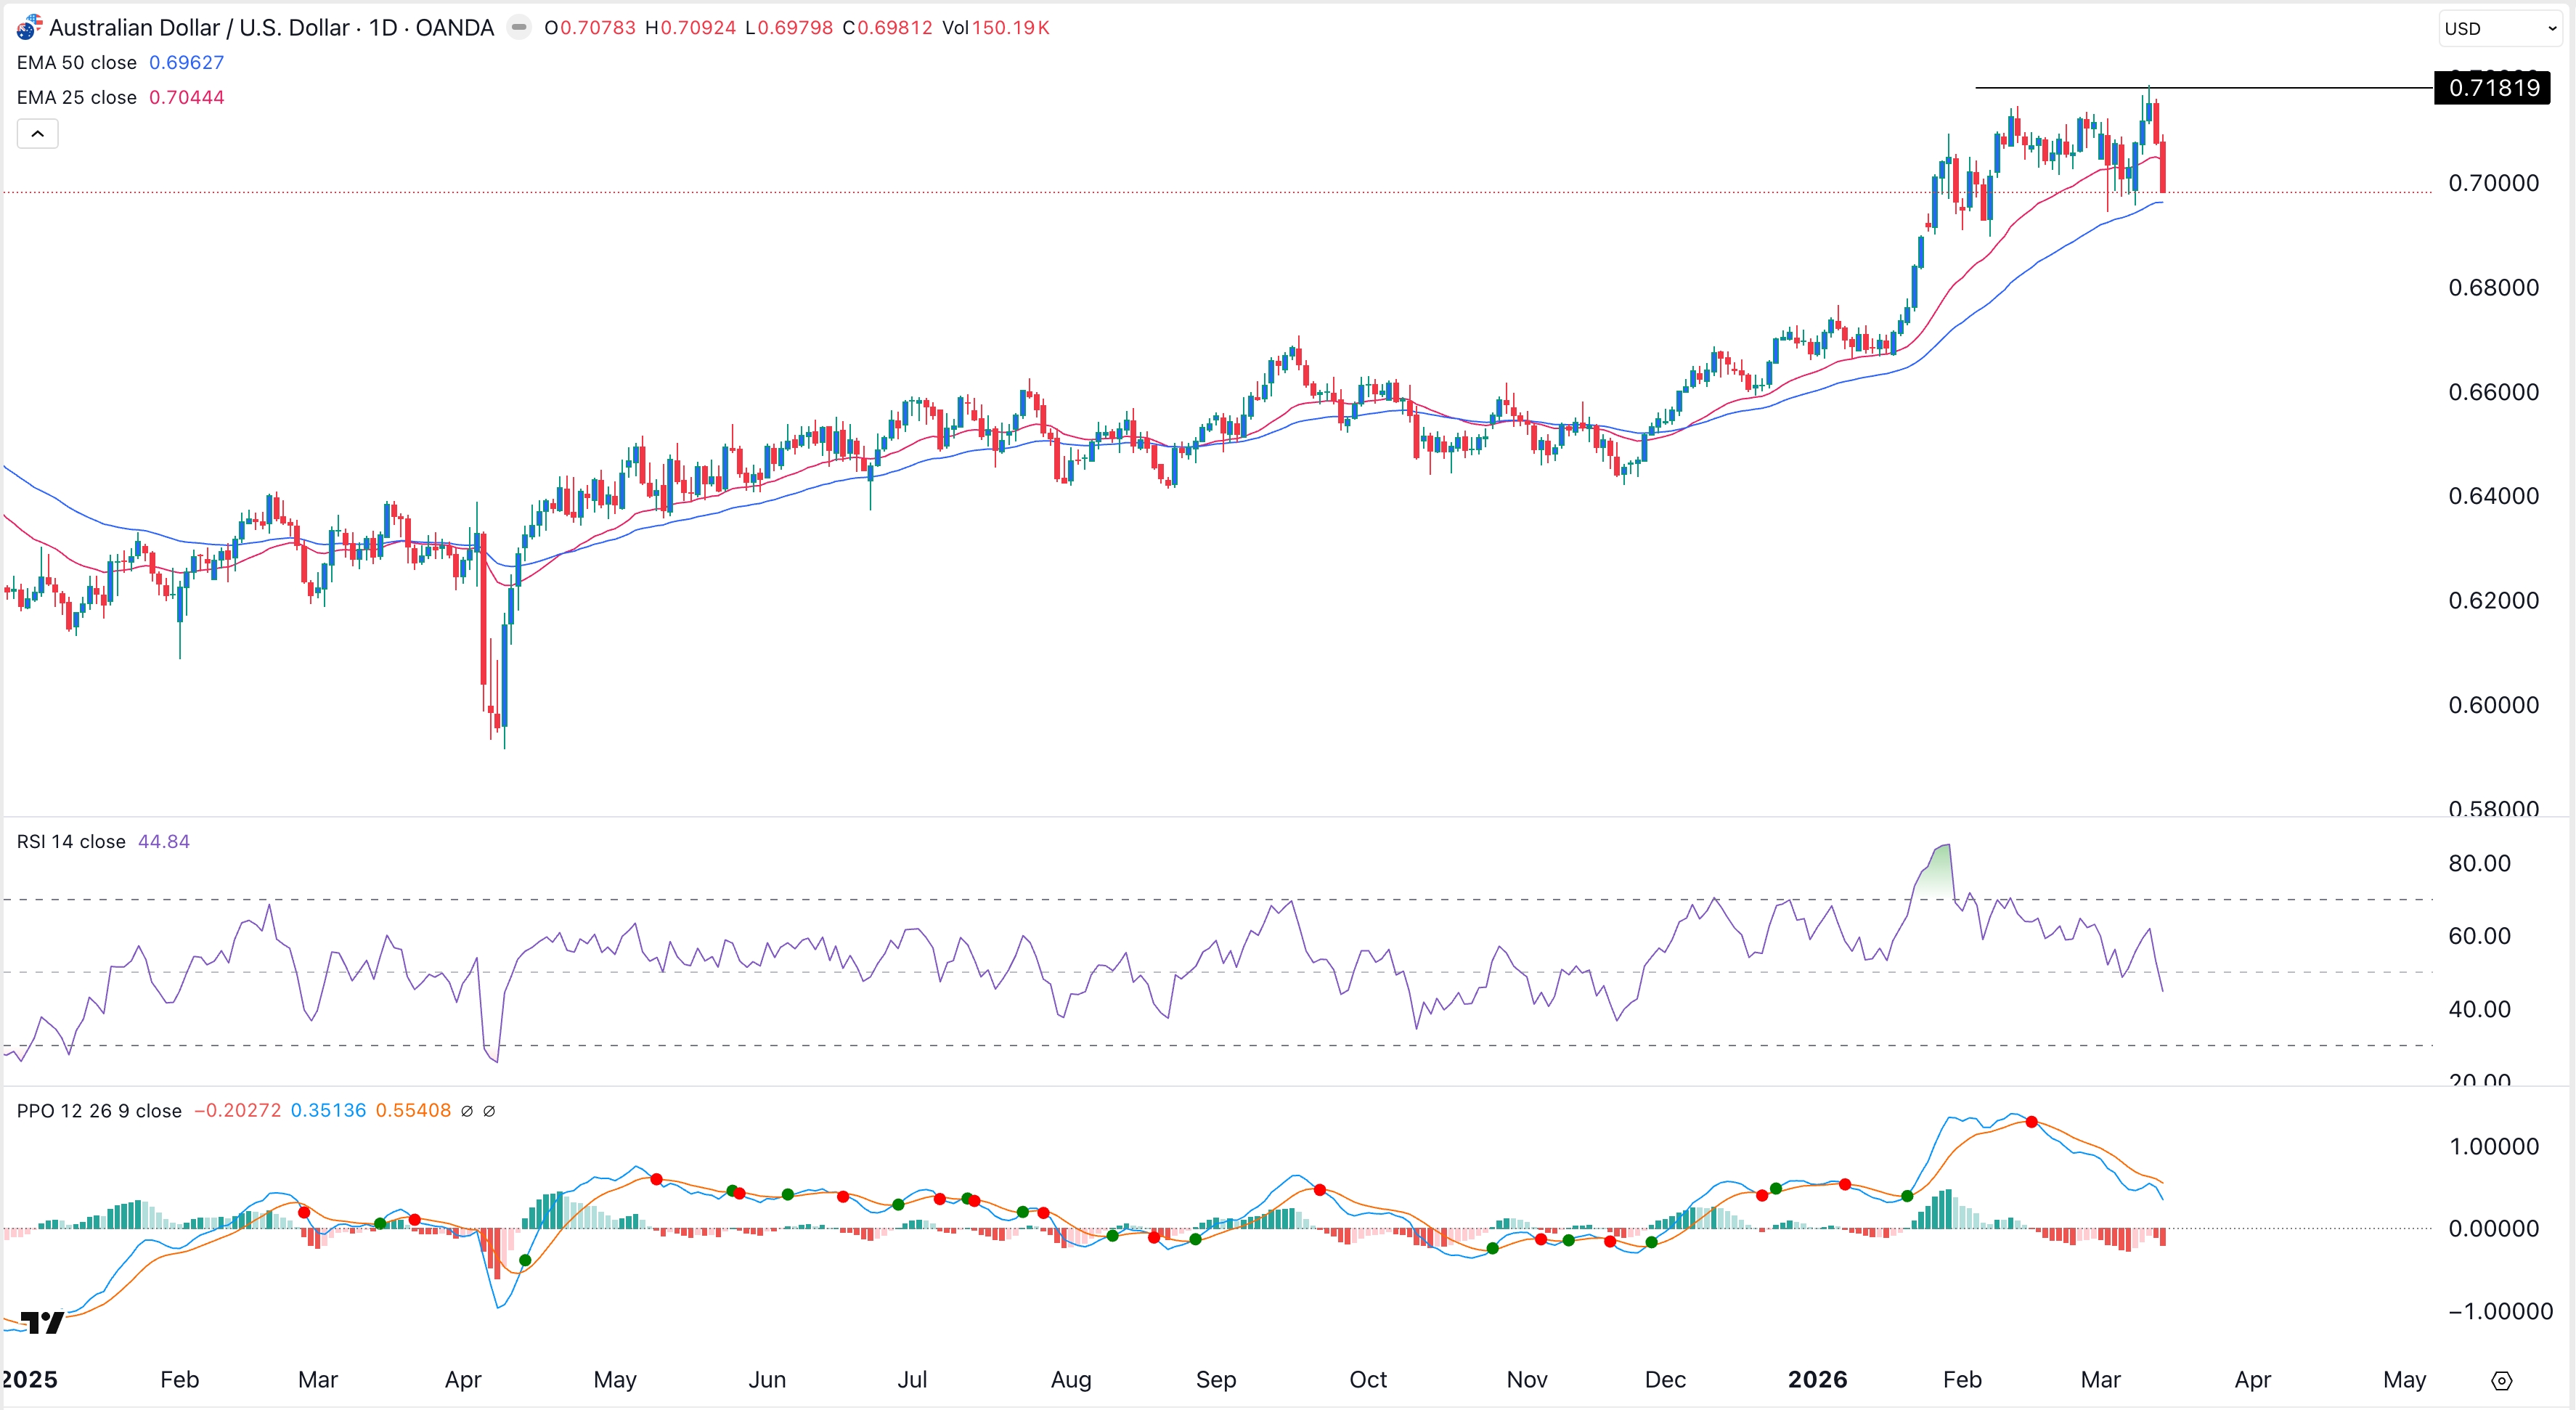
The daily chart shows that the AUD/USD pair pulled back for three consecutive days, reaching its lowest level since July 14. It has moved below the lower side of the ascending channel, which is part of the bearish flag pattern.
The pair has also dropped below the 50-day Exponential Moving Average (EMA), confirming the bearish outlook. At the same time, the Relative Strength Index (RSI) has dropped below the neutral level of 50 and is pointing downwards.
Therefore, the most likely scenario is where the pair continues falling, potentially to the key support level of 0.6865, its lowest level on June 30.