
XRP (XRP) has rebounded by around 23% from its June 6 low near $1.05, rising to about $1.30 on Monday.
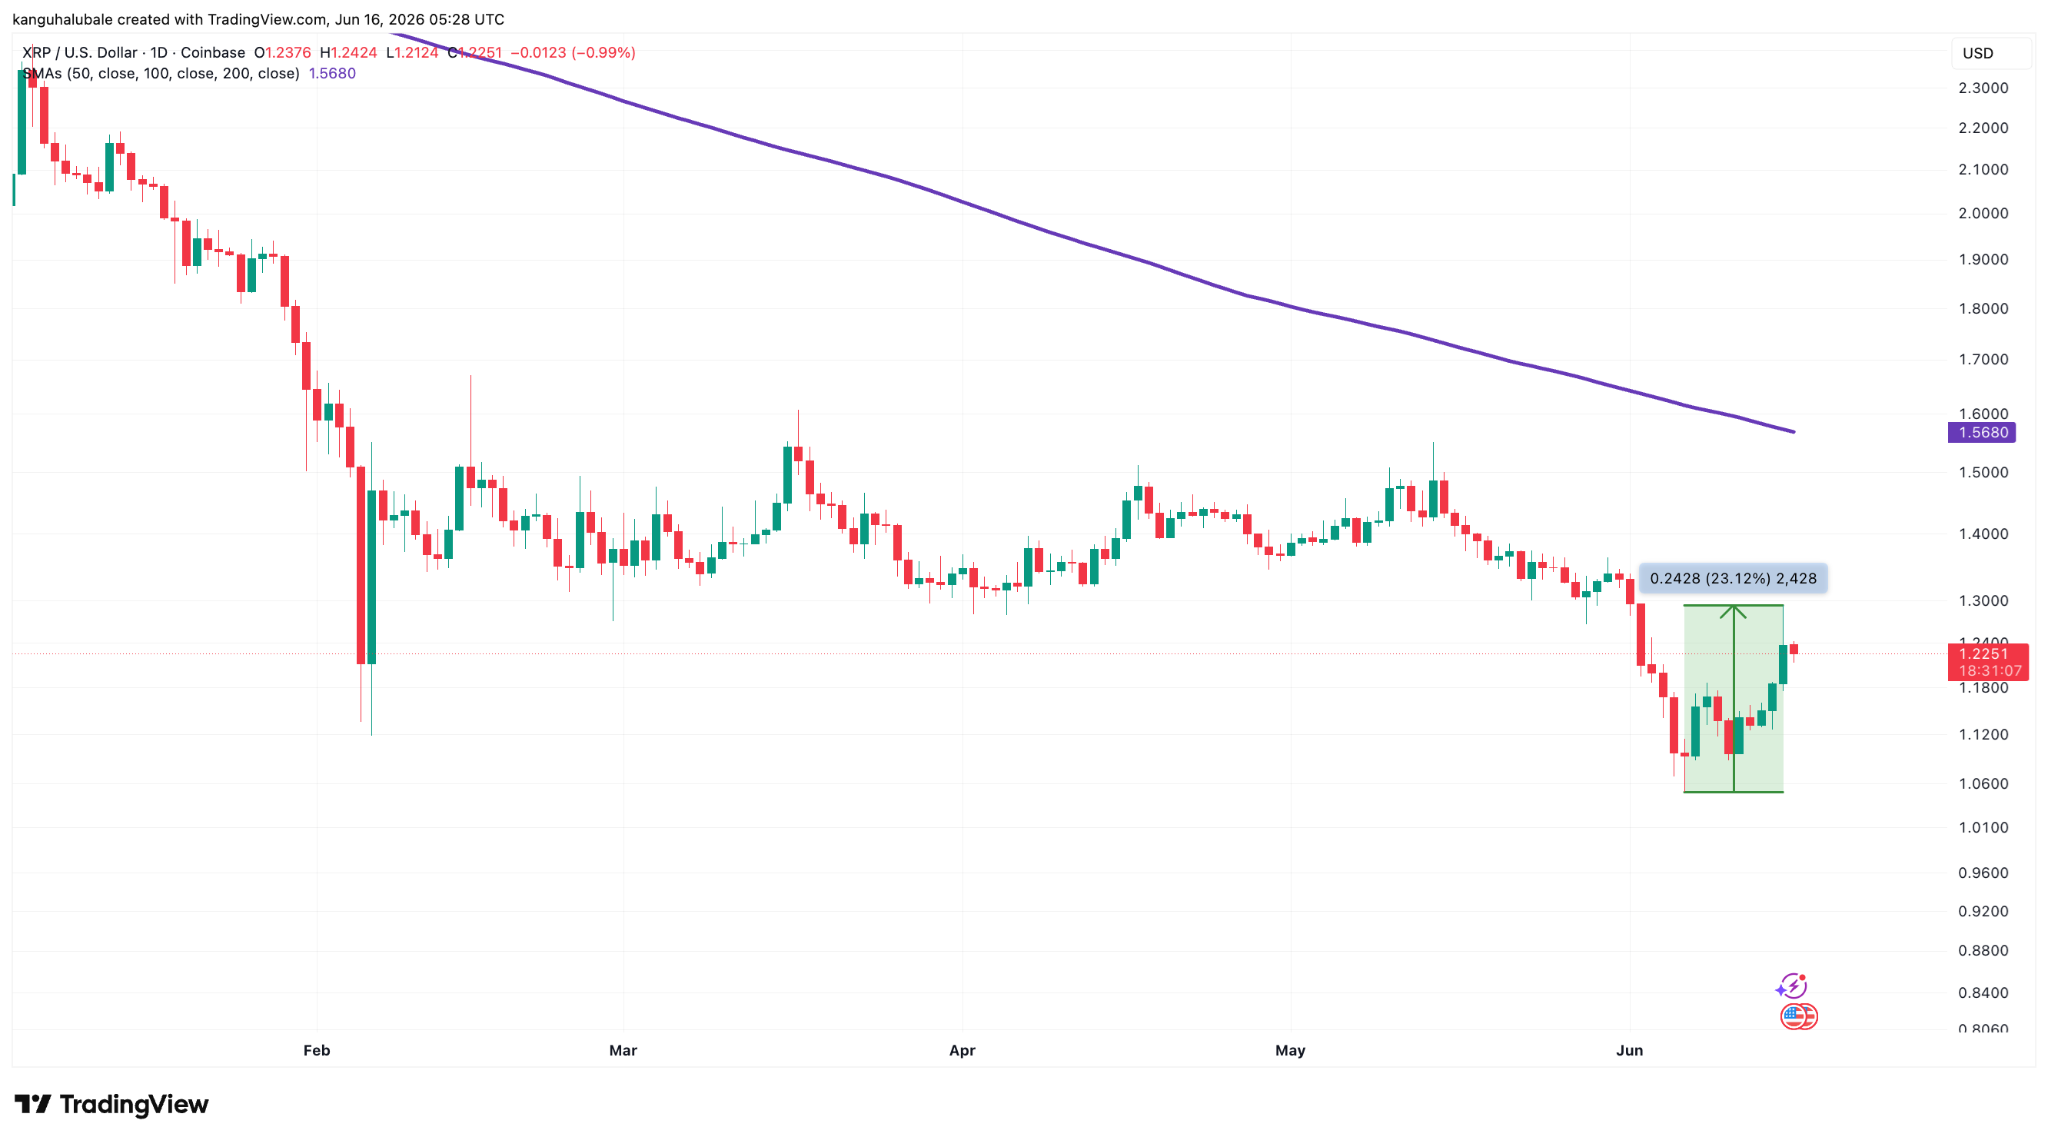
XRP/USD daily chart. Source: TradingView
The move came as traders rotated back into risk assets after the US and Iran reached a preliminary peace deal, which also pressured oil prices lower and supported broader market sentiment.
XRP is now flashing a major bullish reversal setup that could pave the way for a 700% rally.
Crypto Prices Recover on US-Iran Deal
The crypto market recovered on Monday morning after US President Trump claimed that the US had reached a peace deal with Iran that would reopen the Strait of Hormuz.
“The deal with the Islamic Republic of Iran is now complete. Congratulations to all!” Trump said in a post on his Truth Social platform late on Sunday.
Top Regulated Brokers
“I hereby fully authorize the toll-free opening of the Strait of Hormuz, and, simultaneously herewith, authorize the immediate removal of the United States Naval blockade,” Trump said. “Ships of the World, start your engines. Let the oil flow!”
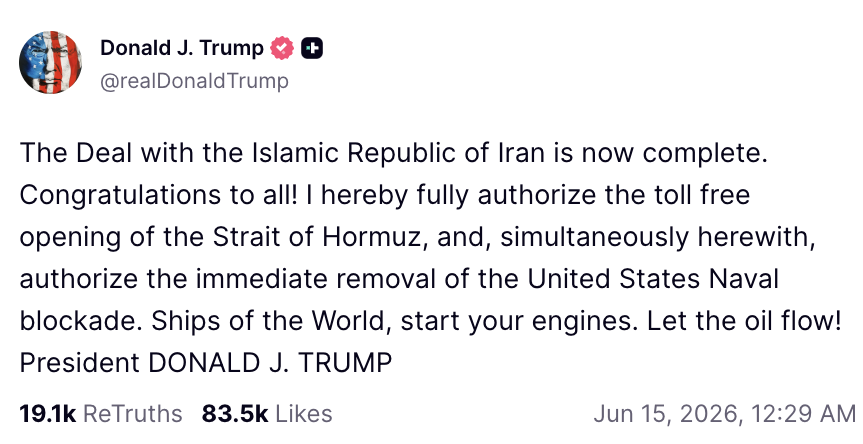
Source: TruthSocial/Donald J. Trump
“With the opening of the Strait upon the signing of the deal on Friday oil will flow on both ends again for the region, and the World!” he said in a separate post.
Markets reacted positively to Trump’s latest claim, with Bitcoin (BTC) reaching $67,248 on Bitstamp on Monday morning, according to TradingView. It is the highest the asset has traded over the last 12 days.
This was accompanied by significant recoveries in other top-cap cryptocurrencies, adding more than $130 billion to the crypto market since Sunday.
The derivatives market saw a similar recovery. More than $630 million in short positions were liquidated over the last three days, with XRP accounting for $15 million of that total. Bitcoin saw the largest short liquidations totaling $380 million.
Across the board, a total of $886.8 million was wiped out of the market in short and long positions, as shown in the figure below.
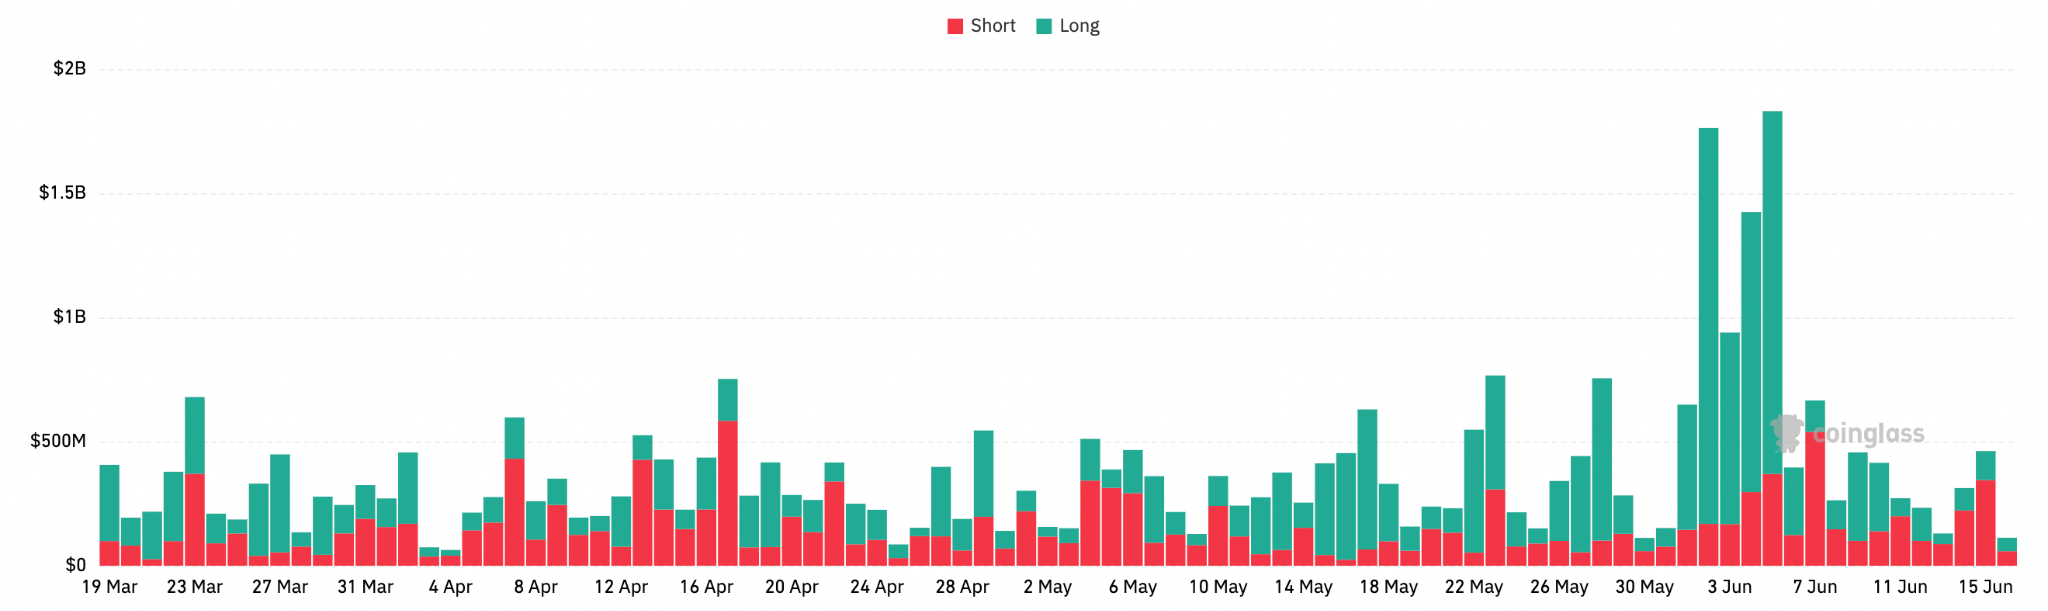
Crypto liquidations. Source: CoinGlass
Additional data from CoinGlass showed a significant increase in XRP futures open interest (OI) over the last 24 hours across all exchanges. The rise was more pronounced on BingX and KuCoin, whose XRP OI has increased by 103% and 23% over the last 24 hours, respectively.
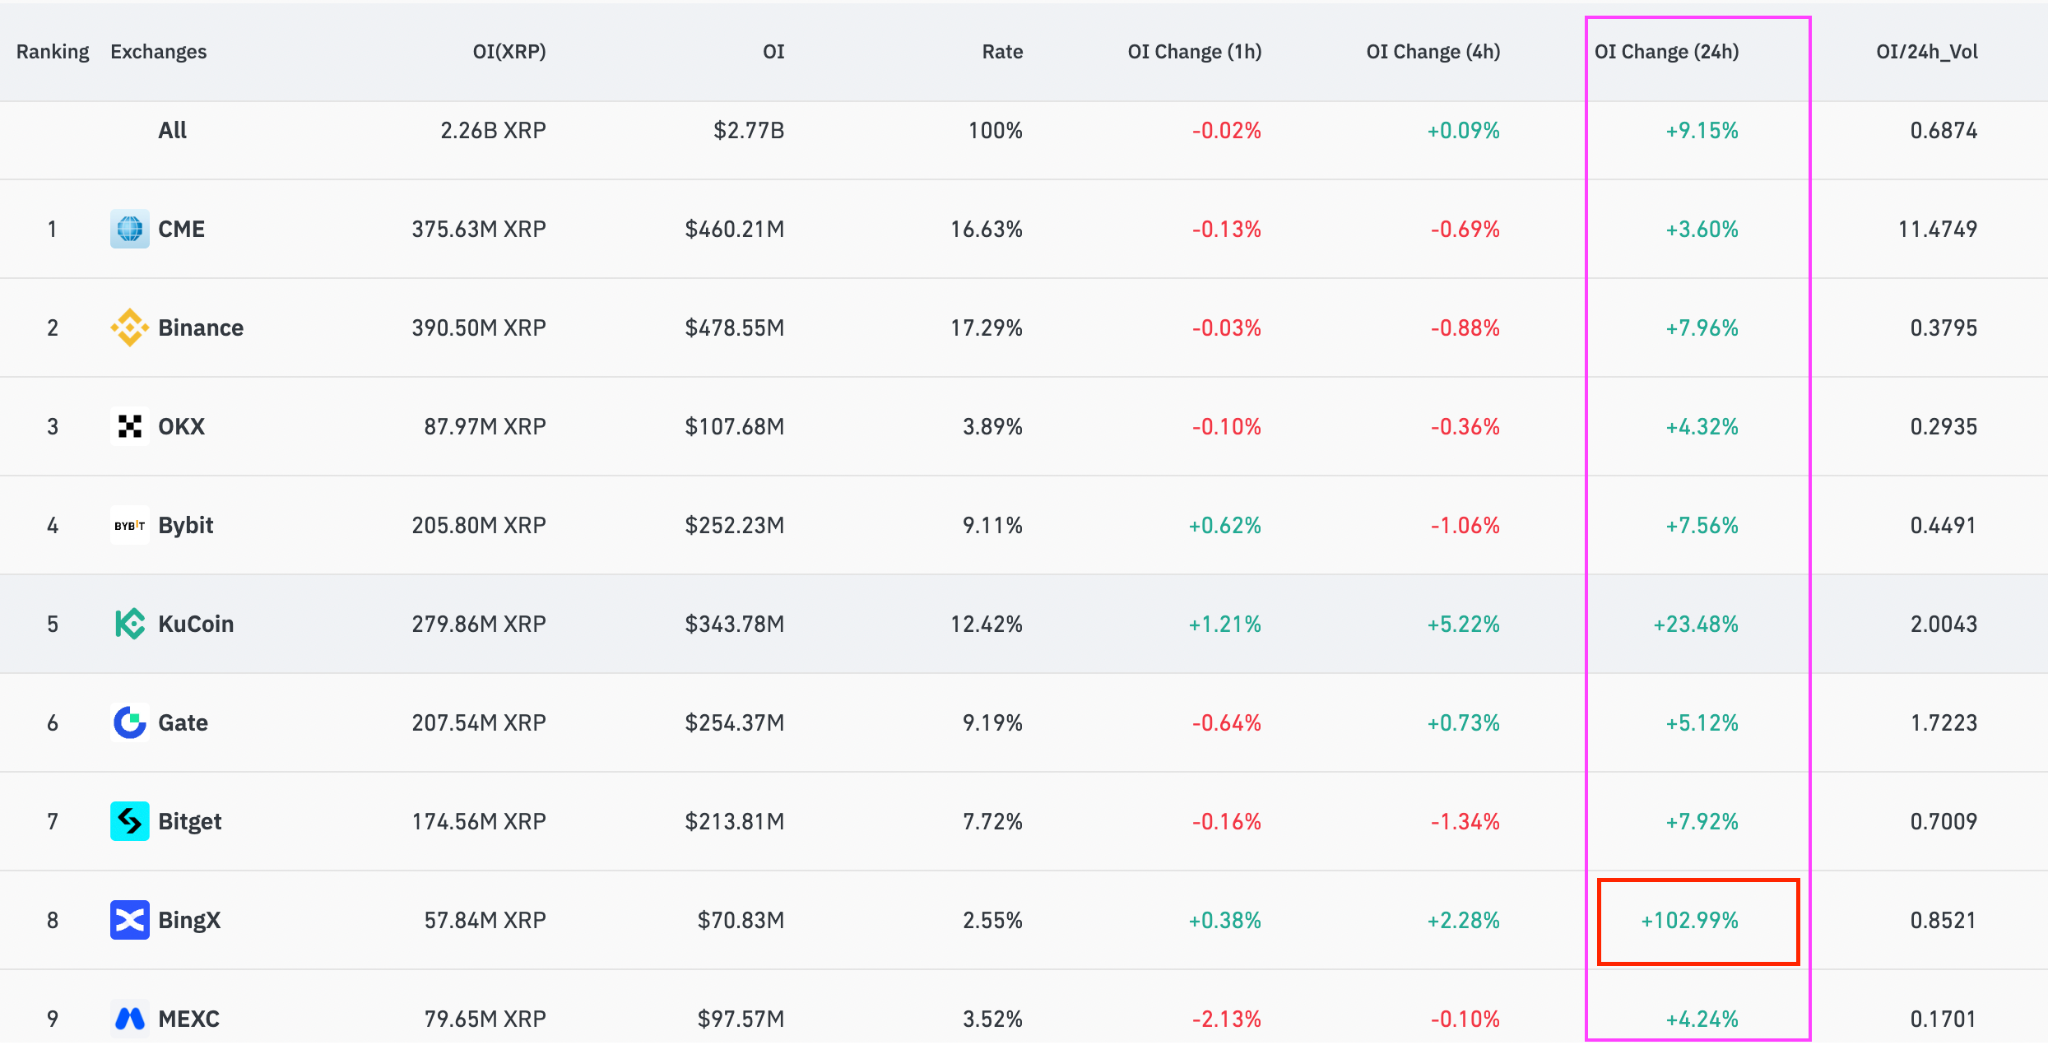
XRP Open Interest. Source: CoinGlass
Even though futures longs (buyers) and shorts (sellers) are always matched, rising OI suggests increased leverage and market participation, often signaling bullish sentiment. For example, a 30% increase in OI between March 8 and March 17 was accompanied by a 27% rally in XRP price.
Meanwhile, US-based spot XRP exchange-traded funds (ETFs) continue to post inflows, indicating steady institutional interest. These ETFs have recorded inflows on every day since April 10, except for April 30 and June 3.
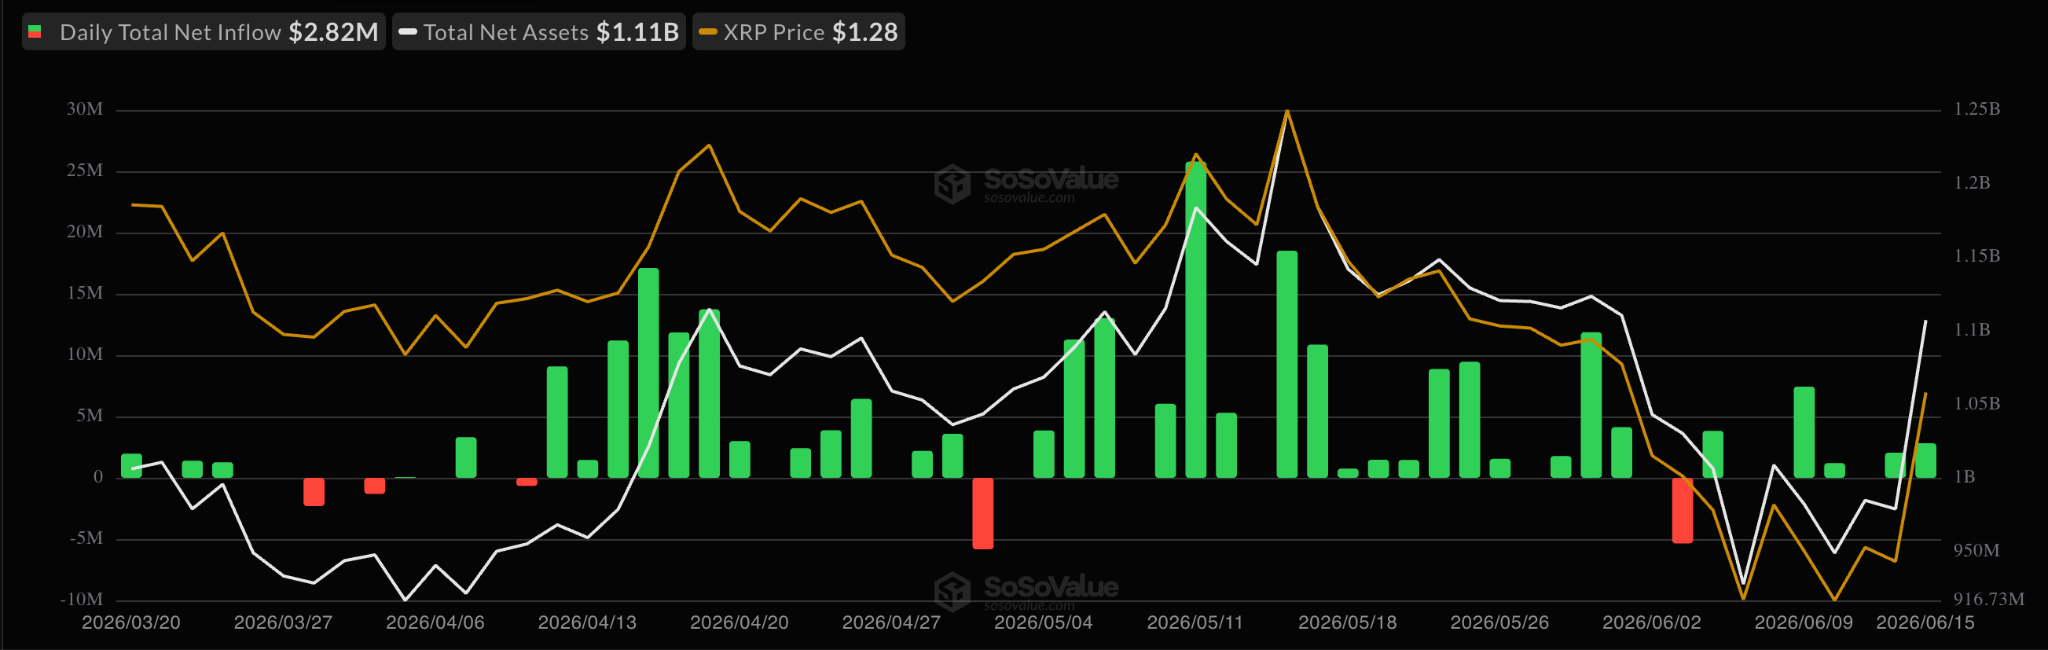
Spot XRP ETF flows chart. Source: SoSoValue
Multi-Year Setup Provides “Second Chance” XRP Rally to $10
The XRP/USD may go on a 5x–7x rally from its "accumulation zone", according to analyst Crypto Patel, who says the recent price action resembles the rebound before its major breakout in mid-2020.
In his Sunday post, Patel highlighted the $0.50–$0.80 range as a potential long-term accumulation zone, arguing that XRP was trading at a level that last preceded a larger upside move.
“The market just gave you a second chance,” the analyst said, adding:
“After all these years, #XRP is still trading around the same level. Patience pays.”
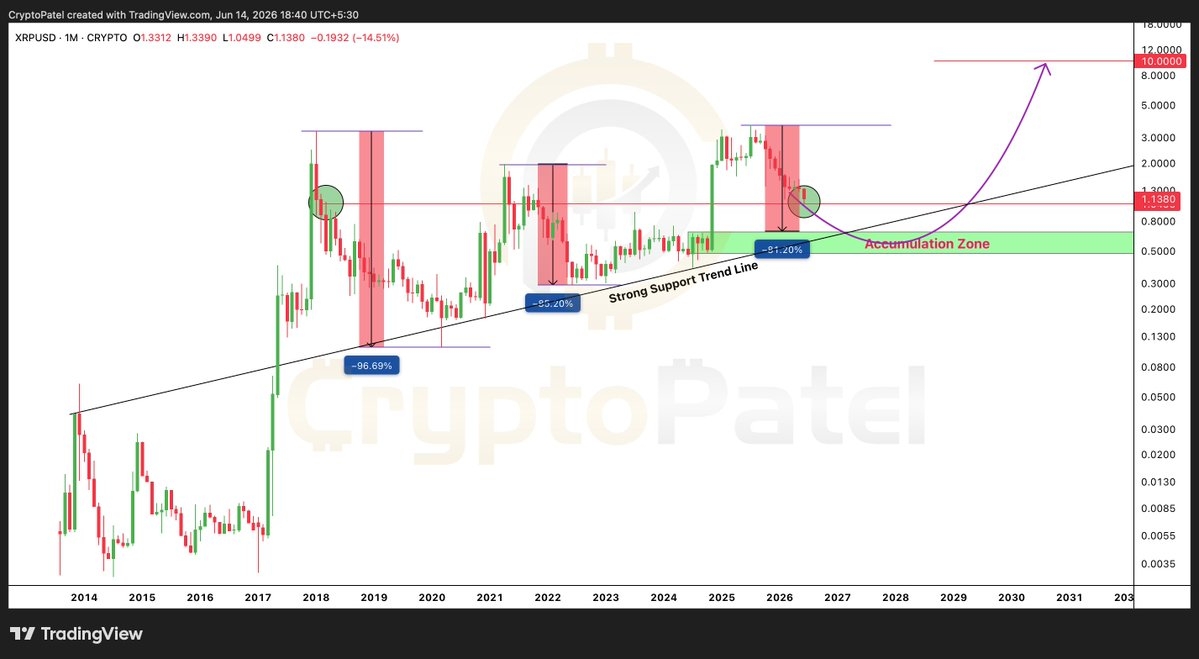
XRP/USD monthly chart. Source: Crypto Patel
The analyst projected upside targets at $5 and $10, implying roughly 5x–7x potential from the current price if XRP repeats previous cycle-style expansions.
That comparison is central to Patel’s bullish case.
XRP spent months building a base around the $0.32–$0.40 area between 2022 and 2024 before bouncing off a multi-year ascending trend line near $0.55–$0.60 in November 2024.
The breakout also cleared the broader $1.40 resistance zone, marked in red on the chart, followed by an 585% rally toward $2.90 in December 2024.
Bear Flag Keeps XRP Breakdown Risk Alive
The bullish setup is not risk-free.
Despite XRP’s latest rebound, the price still trades below a bear flag on the weekly chart. The pattern formed after the sharp early-2026 selloff, with price now hovering below a small upward-sloping channel, as shown in the chart below.
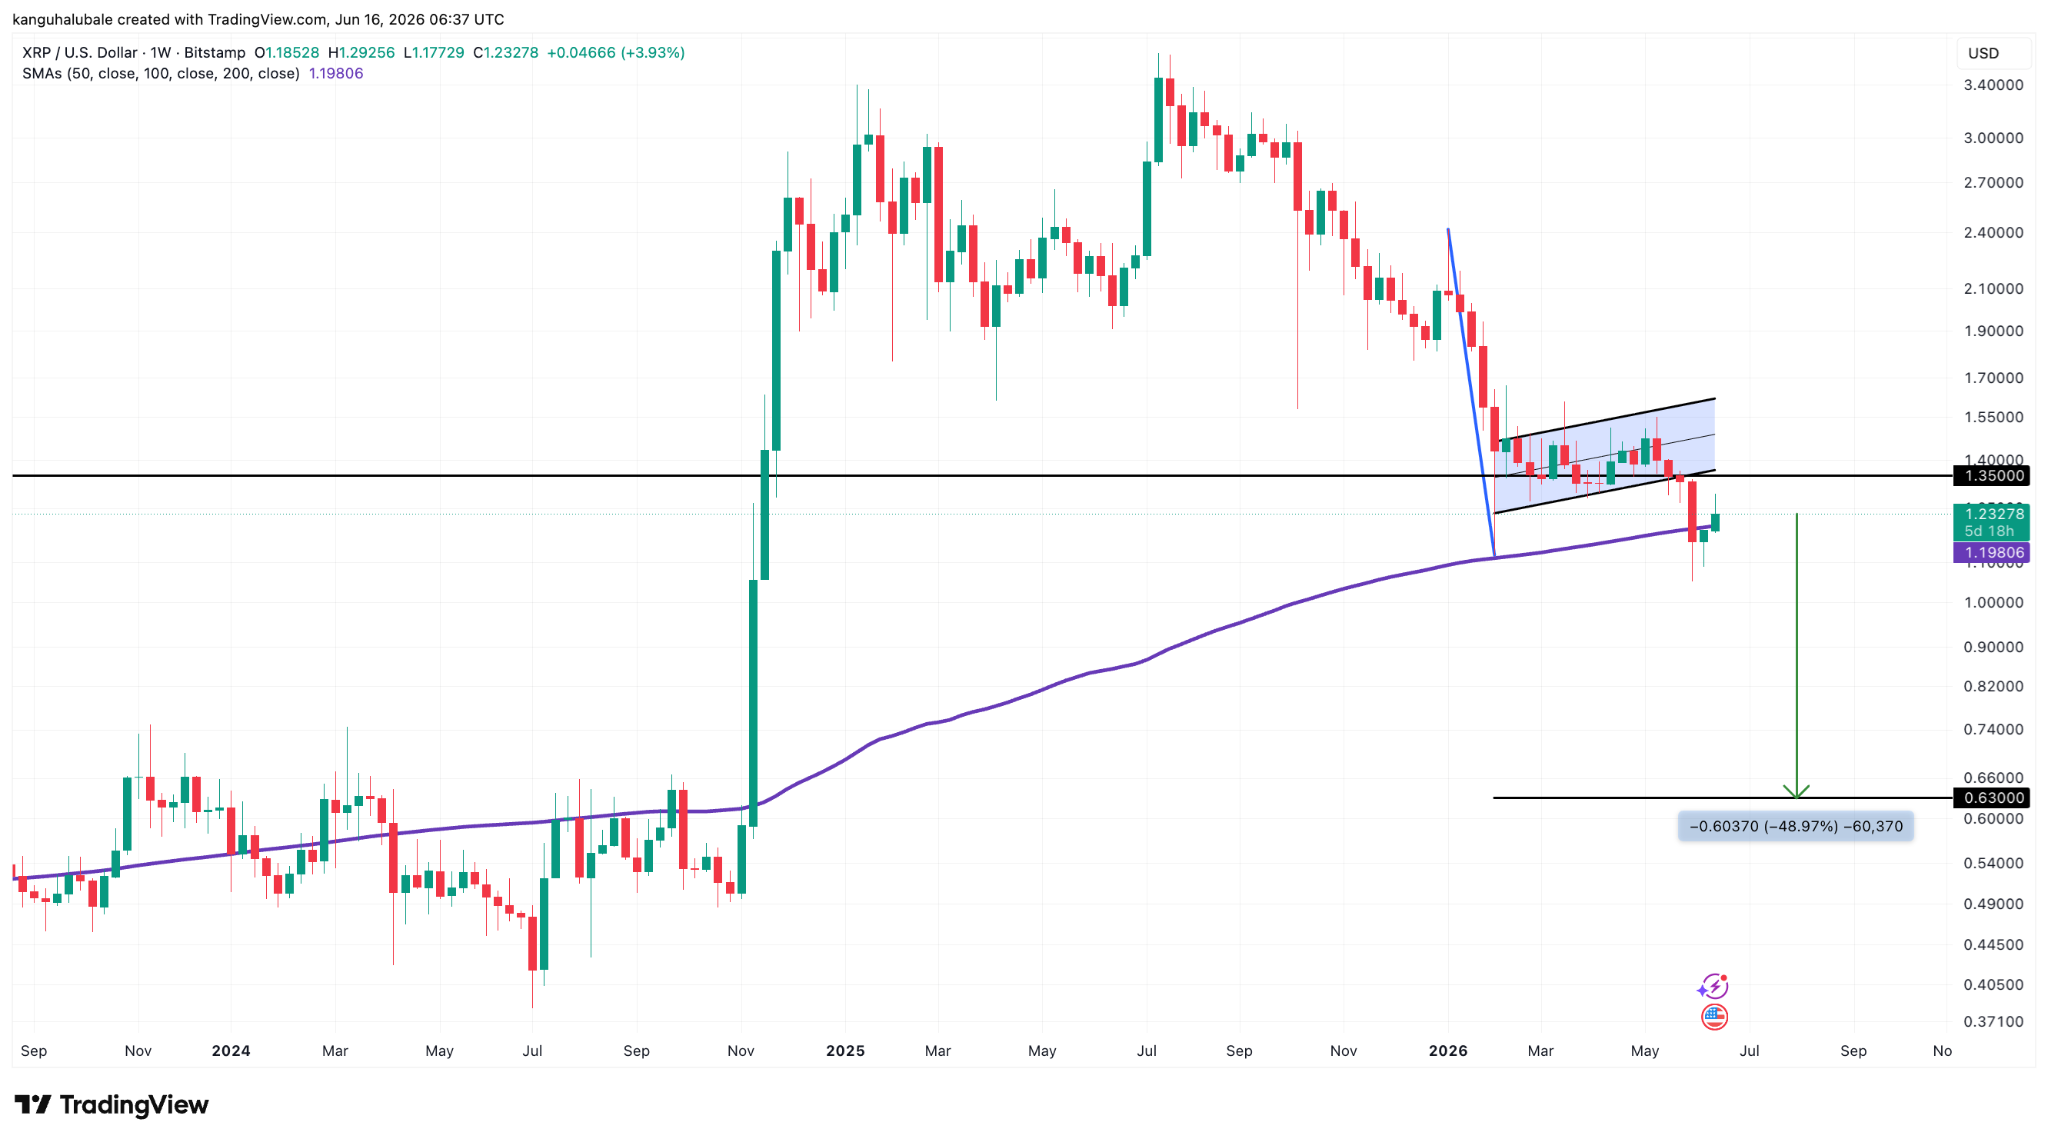
XRP/USD weekly price chart. Source: TradingView
A bear flag usually shows temporary consolidation before sellers resume control. In XRP’s case, that means the current recovery could still be a relief bounce unless bulls force a clean breakout above $1.60.
The first bearish trigger sits near the 200-week simple moving average at $1.20. A weekly close below that area would expose XRP to downward risks.
If selling pressure accelerates, the bear flag’s measured downside target sits near $0.63, about 50% from the current price.
Ready to trade our analysis of Ripple? Here’s our list of the best MT4 crypto brokers worth checking out.