
Bearish view
Sell the BTC/USD pair and set a take-profit at 58,000.
Add a stop-loss at 68,000.
Timeline: 1-2 days.
Bullish view
Buy the BTC/USD pair and set a take-profit at 68,000.
Add a stop-loss at 58,000.
Bitcoin price held steady on Tuesday morning, continuing a recovery that started after it plunged below the key support level of $60,000. The BTC/USD pair was trading at 63,500 as focus shifted to the US consumer inflation report.
Top Regulated Brokers
Bitcoin Price Steady Amid Dip Buying
The BTC/USD pair rose slightly as investors started buying the dip despite the elevated risks in the market. This dip buying also happened across key sectors, including the stock market. For example, the Nasdaq 100 Index jumped by 420 points as semiconductor stocks had their best day of the year.
The ongoing rebound happened as investors reacted to the falling energy prices after President Donald Trump asked Israel and Iran to stop shooting each other. Brent and the West Texas Intermediate (WTI) dropped to $94 and $91, respectively.
The next important catalyst for Bitcoin will happen on Wednesday when the US publishes its consumer inflation report. Data released by the Bureau of Labor Statistics (BLS) is expected to show that the headline Consumer Price Index (CPI) jumped to 4.2% in May this year. If this is accurate, it means that inflation has moved further away from the Fed target of 2.0%.
A high inflation rate than expected means that the Federal Reserve will maintain its hawkish tone this year. It may even hike interest rates at least once this year, a move that may hurt Bitcoin and other risky assets.
Another risk for Bitcoin is the ongoing spot Bitcoin ETF outflows, a sign that demand is waning. These funds have shed over $1 billion in each of the last four weeks, a sign that institutional investors are selling.
BTC/USD Technical Analysis
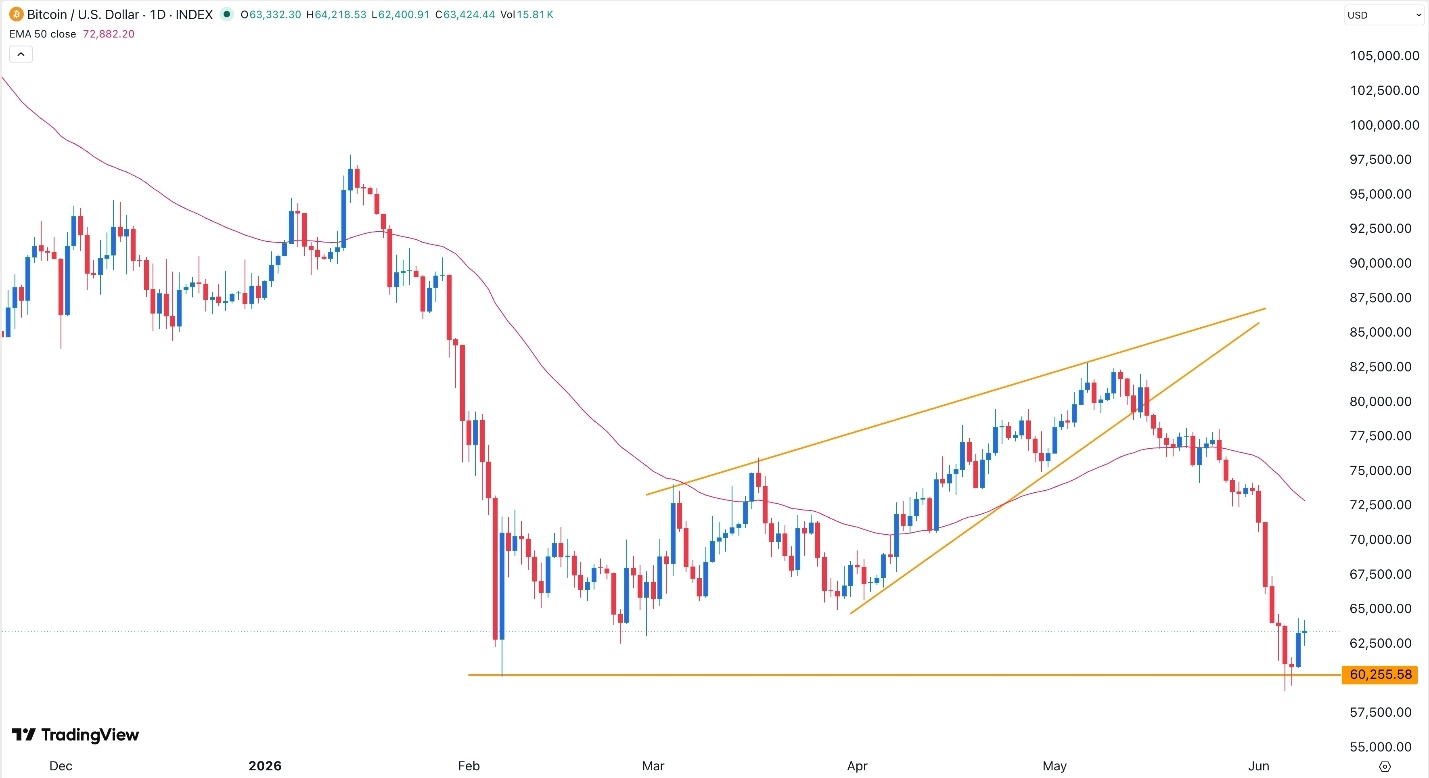
Bitcoin price has been in a bearish trend in the past few months, in which it plunged from a record high to $59,800 during the weekend. Most recently, it dropped from a high of $82,607 on May 6 this year.
The BTC/USD pair has remained below the 50-day and 100-day Exponential Moving Averages (EMA). That is a sign that bears are in control. Also, the pair remains below the Ichimoku cloud indicator. The pair remains strongly above the key support level at 63,530.
There is a likelihood that the ongoing rebound is a dead-cat bounce, which is normally a temporary rebound. A retreat below the key support level at 60,000 will point to more downside, potentially to 58,000.
Ready to trade our free daily Forex trading signals? We’ve shortlisted the best MT4 crypto brokers in the industry for you.