
Bearish view
Sell the BTC/USD pair and set a take-profit at 60,000.
Add a stop-loss at 70,000.
Timeline: 1-3 days.
Bullish view
Buy the BTC/USD pair and set a take-profit at 70,000.
Add a stop-loss at 60,000.
Bitcoin price held steady above $64,000 on Monday as risks in the cryptocurrency industry remained. The BTC/USD pair has risen by nearly 10% from its lowest point this month.
Top Regulated Brokers
Bitcoin Price Steady Despite Falling ETF Demand
The BTC/USD pair rose even as some major risks in the market remained. For one, data shows that spot Bitcoin ETF outflows continued last week. These funds, led by IBIT, shed $226 million in assets last week, bringing the cumulative total inflows to over $53 billion.
These funds have had outflows in the last six consecutive weeks. They have lost over $6 billion in the last few weeks, a trend that may continue in the foreseeable future. This is happening as investors rotate from cryptocurrencies to the stock market, which is firing on all cylinders, helped by the artificial intelligence boom.
The BTC/USD pair has also done well in the past few days, even after the Federal Reserve delivered a highly hawkish interest rate decision. It left rates unchanged between 3.50% and 3.75%, with officials signaling that they will hike later this year.
Odds of a rate increase jumped after the recent macro data. A report released earlier this month showed that the headline consumer inflation jumped to 4.2% in May. Another one showed that the economy created over 172k jobs in May, the third consecutive month of strong numbers. The hawkish tone helped to push the US dollar to its highest point in months.
Looking forward, the BTC/USD pair will likely remain under pressure this week as investors remain focused on the AI boom. The key drivers that may drive the crypto market will be the Micron earnings, US GDP, and the PCE report.
BTC/USD Technical Analysis
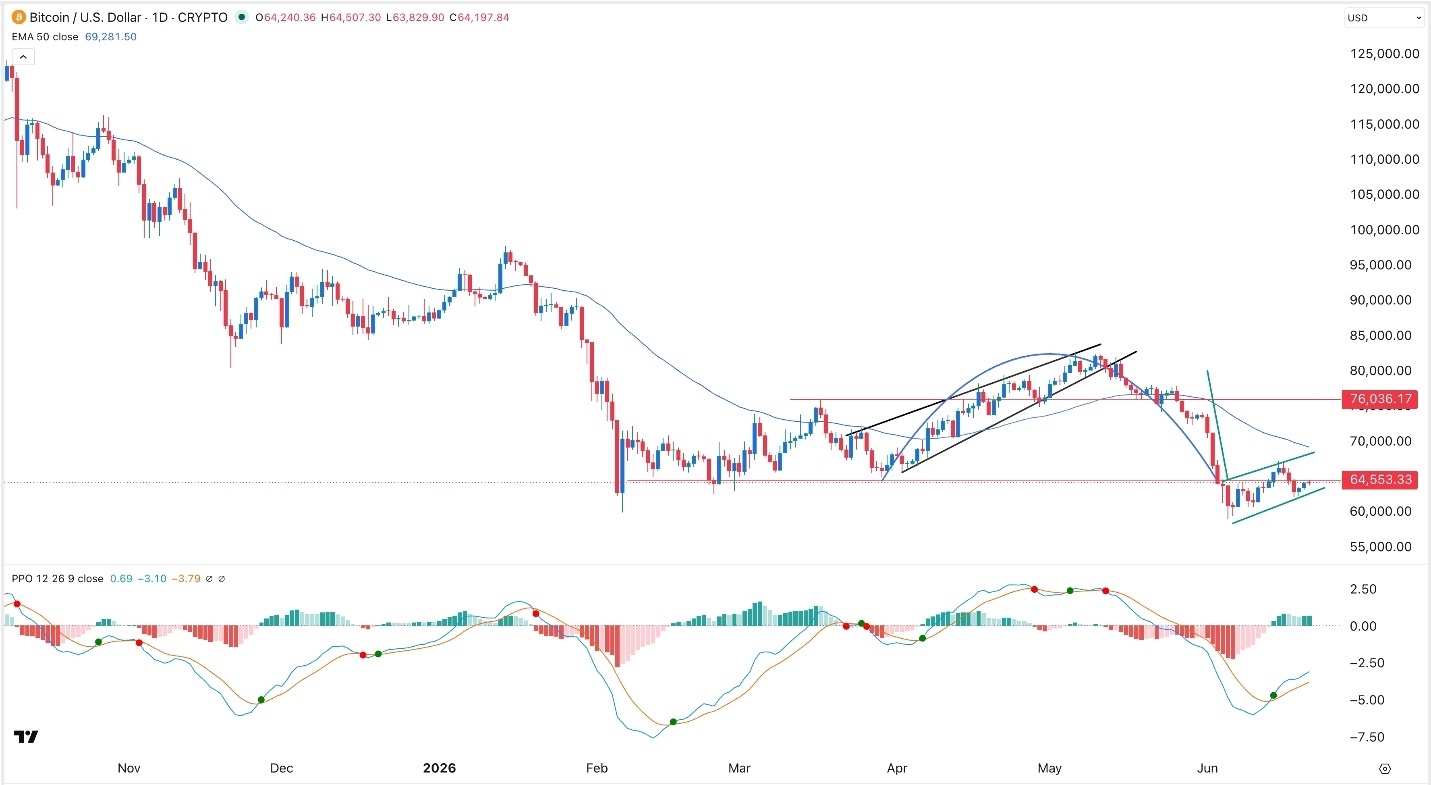
The daily chart reveals that the BTC/USD pair has held steady in the past few days, moving from a low of 59,110 earlier this month to the current 64,200.
This chart shows that it is not out of the woods yet. It has formed a bearish flag pattern, which is made up of a vertical line and an ascending channel. This pattern is one of the most common bearish signs in technical analysis. It has retested the lower side of the pattern, confirming a break-and-retest pattern.
The BTC/USD pair has remained below the 50-day moving average. Therefore, the most likely scenario is where it resumes the downward trend and hits the year-to-date low of 60,000.
Ready to trade our free daily Forex trading signals? We’ve shortlisted the best MT4 crypto brokers in the industry for you.