
Bearish view
Sell the BTC/USD pair and set a take-profit at 60,000.
Add a stop-loss at 70,000.
Timeline: 1-2 days.
Bullish view
Buy the BTC/USD pair and set a take-profit at 70,000.
Add a stop-loss at 60,000.
The BTC/USD pair held steady above the key resistance level of 60,000 as ETF outflows slowed and as geopolitical tensions eased. Bitcoin price jumped to $64,000, much higher than the year-to-date low of $59,100.
Bitcoin ETF Outflows Slow Amid Risk-On Sentiment
The BTC/USD pair has done well in the past few days, continuing a rebound that started when it bottomed at 59,100. This rebound has coincided with the slowing BTC ETF outflows.
Data shows that these funds added $85 million in assets on Friday, the first day of inflows since June 4. As a result, these assets shed over $315 million in assets last week. While this is a big number, it was much lower than the $1.72 billion they lost a week earlier. The funds had shed over $1 billion in assets in the past four consecutive weeks. There is a likelihood that Bitcoin ETF inflows will start doing well now that the SpaceX IPO has happened.
Top Regulated Brokers
The BTC/USD pair has also done well as geopolitical risks eased, leading to a risk-on sentiment among investors. Crude oil prices have continued falling after the US and Iran reached a deal to end the war, at least for 60 days.
The falling oil prices mean that inflation may have peaked, which will help to reduce the possibility that the Federal Reserve will hike interest rates. Indeed, data show that US bond yields have continued falling in the past few days. The ten-year yield retreated to 4.48% from the year-to-date high of 4.68%. Similarly, the two-year yield dropped to 4.08%.
The next key catalyst for the BTC/USD pair will be the upcoming Federal Reserve interest rate decision. Economists expect the bank to leave interest rates unchanged between 3.5% and 3.75%.
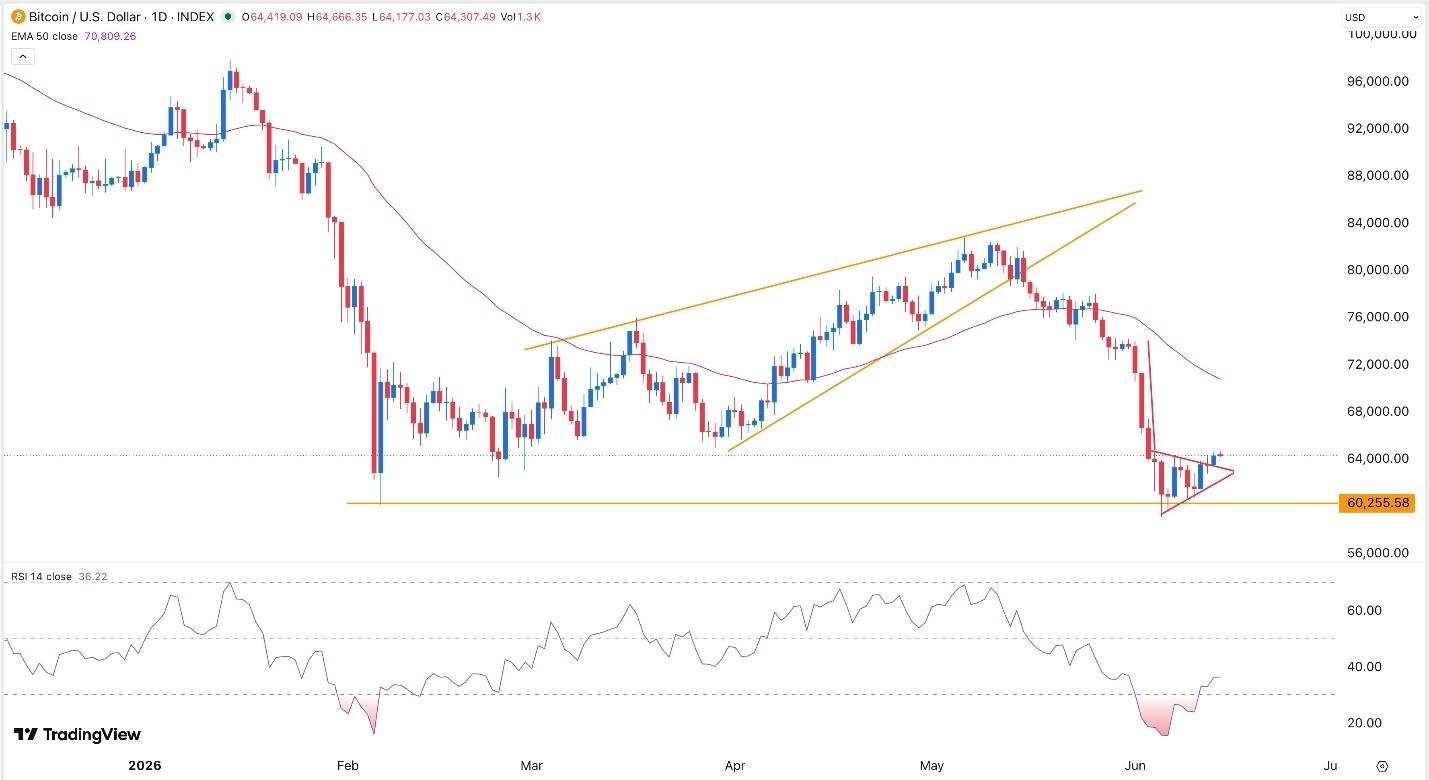
BTC/USD Technical Analysis
The daily chart shows that the BTC/USD pair has held steady in the past few days, moving from a low of 59,100 to 64,000 today. However, there is still a risk that this rebound is a dead-cat bounce.
For one, it has formed a bearish pennant pattern, which is made up of a vertical line and a symmetrical triangle. This pattern normally leads to more downside over time.
Bitcoin has also moved below all moving averages. Therefore, there is a risk that the BTC/USD pair will have a bearish breakout in the near term. If this happens, the next key level to watch will be at 60,000. The alternative scenario is where Bitcoin continues rising as bulls target the key resistance level at 70,000.
Ready to trade our daily Forex signals? Here’s a list of some of the best crypto brokers to check out.