
Bearish view
Sell the BTC/USD pair and set a take-profit at 55,000.
Add a stop-loss at 65,000.
Timeline: 1-2 days.
Bullish view
Buy the BTC/USD pair and set a take-profit at 65,000.
Add a stop-loss at 55,000.
Bitcoin price remained in a tight range slightly above the important support level of $60,000. The BTC/USD pair was trading at 61,825 on Thursday, a few points above the year-to-date low of 59,185. This retreat may continue as investors focus on the upcoming SpaceX IPO.
Top Regulated Brokers
Bitcoin Demand Remains Thin Amid Tech Hype
The BTC/USD pair has remained inside a narrow range this week after it plunged to its lowest level since 2024. This is happening amid the ongoing indecision among investors and as liquidity dries in the industry, as focus shifts to the upcoming SpaceX IPO.
The company plans to raise $75 billion at a $1.78 trillion valuation. However, data shows that the IPO is four times subscribed, meaning that it may raise over $225 billion.
As a result, there are signs that the IPO has drained liquidity from the market, which explains why the stock market has also retreated. The Dow Jones Index retreated by over 800 points, while the S&P 500 and Nasdaq 100 fell by 102 and 736 points, respectively. Also, the VIX Index jumped by 10% to $22.
The BTC/USD pair wavered as spot Bitcoin ETFs continued shedding assets this week. These funds have lost nearly $2 billion in assets this month, after losing $2.5 billion last month. Some of these funds have flowed towards the stock market.
Bitcoin also remained under pressure after the US published strong consumer inflation numbers. This report showed that the headline Consumer Price Index (CPI) rose from 3.8% in April to 4.2% in May. As a result, there are signs that the Federal Reserve will hike interest rates later this year.
BTC/USD Technical Analysis
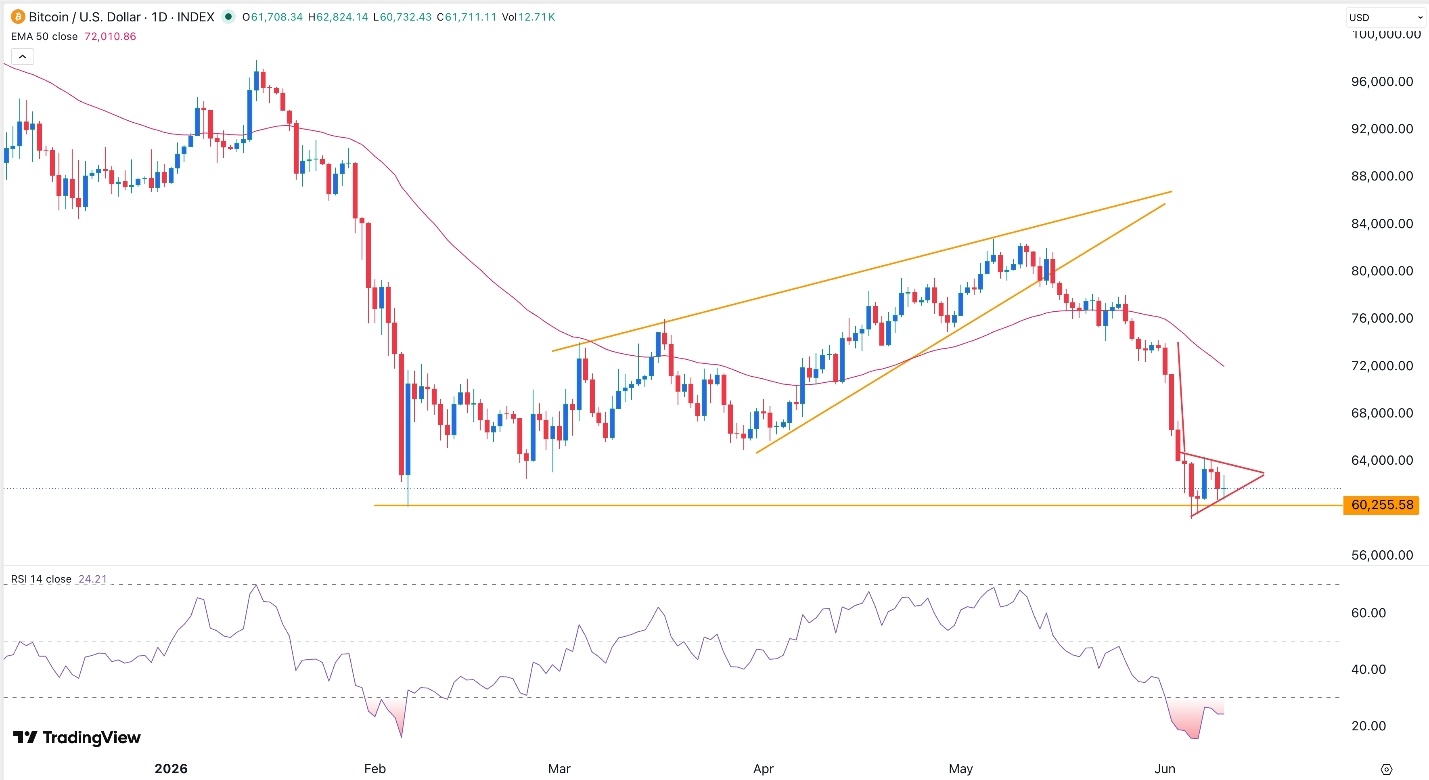
The daily chart shows that Bitcoin price has slumped in the past few weeks. It dropped below the important support level at 60,000 during the weekend and pulled back.
The BTC/USD pair has remained below the 50-day moving average and is slowly forming a bearish pennant pattern. Also, the Relative Strength Index (RSI) has dropped to the oversold level.
Therefore, the most likely scenario is where it resumes the downward trend, potentially to the key support at 55,000.
Ready to trade our free daily Forex trading signals? We’ve shortlisted the best MT4 crypto brokers in the industry for you.