
Bullish view
Buy the GBP/USD pair and set a take-profit at 1.3700.
Add a stop-loss at 1.3400.
Timeline: 1-2 days.
Bearish view
Sell the GBP/USD pair and set a take-profit at 1.3400.
Add a stop-loss at 1.3700.
The GBP/USD exchange rate continued rising, reaching its highest level since February 11 this year. It rose to 1.3652, up sharply from the year-to-date low of 1.3162. This rally happened as a divergence between the Federal Reserve and the Bank of England emerged.
Federal Reserve and Bank of England Divergence
The GBP/USD pair rose after the Federal Reserve and the Bank of England (BoE) delivered their interest rate decisions.
The two banks decided to leave interest rates unchanged, continuing a trend that has been going on in the past few months.
However, these are signs that the BoE will decide to hike interest rates in the next meeting in June, citing the strong inflation as the US-Iran war continued. The most recent data showed that the headline consumer price index (CPI) rose to 3.3% in March this year, moving further away from the bank’s target of 2.0%.
The Federal Reserve, on the other hand, decided to leave interest rates unchanged between 3.50% and 3.75%, continuing a trend that has been going on for months. Its statement hinted that the bank will be willing to cut rates this year.
The next key catalyst for the GBP/USD pair will be the upcoming US macro data, including the upcoming non-farm payrolls data. These numbers will provide more color on the state of the economy. Economists expect the data to show that the labor market deteriorated, while the unemployment rate remained at 4.3%.
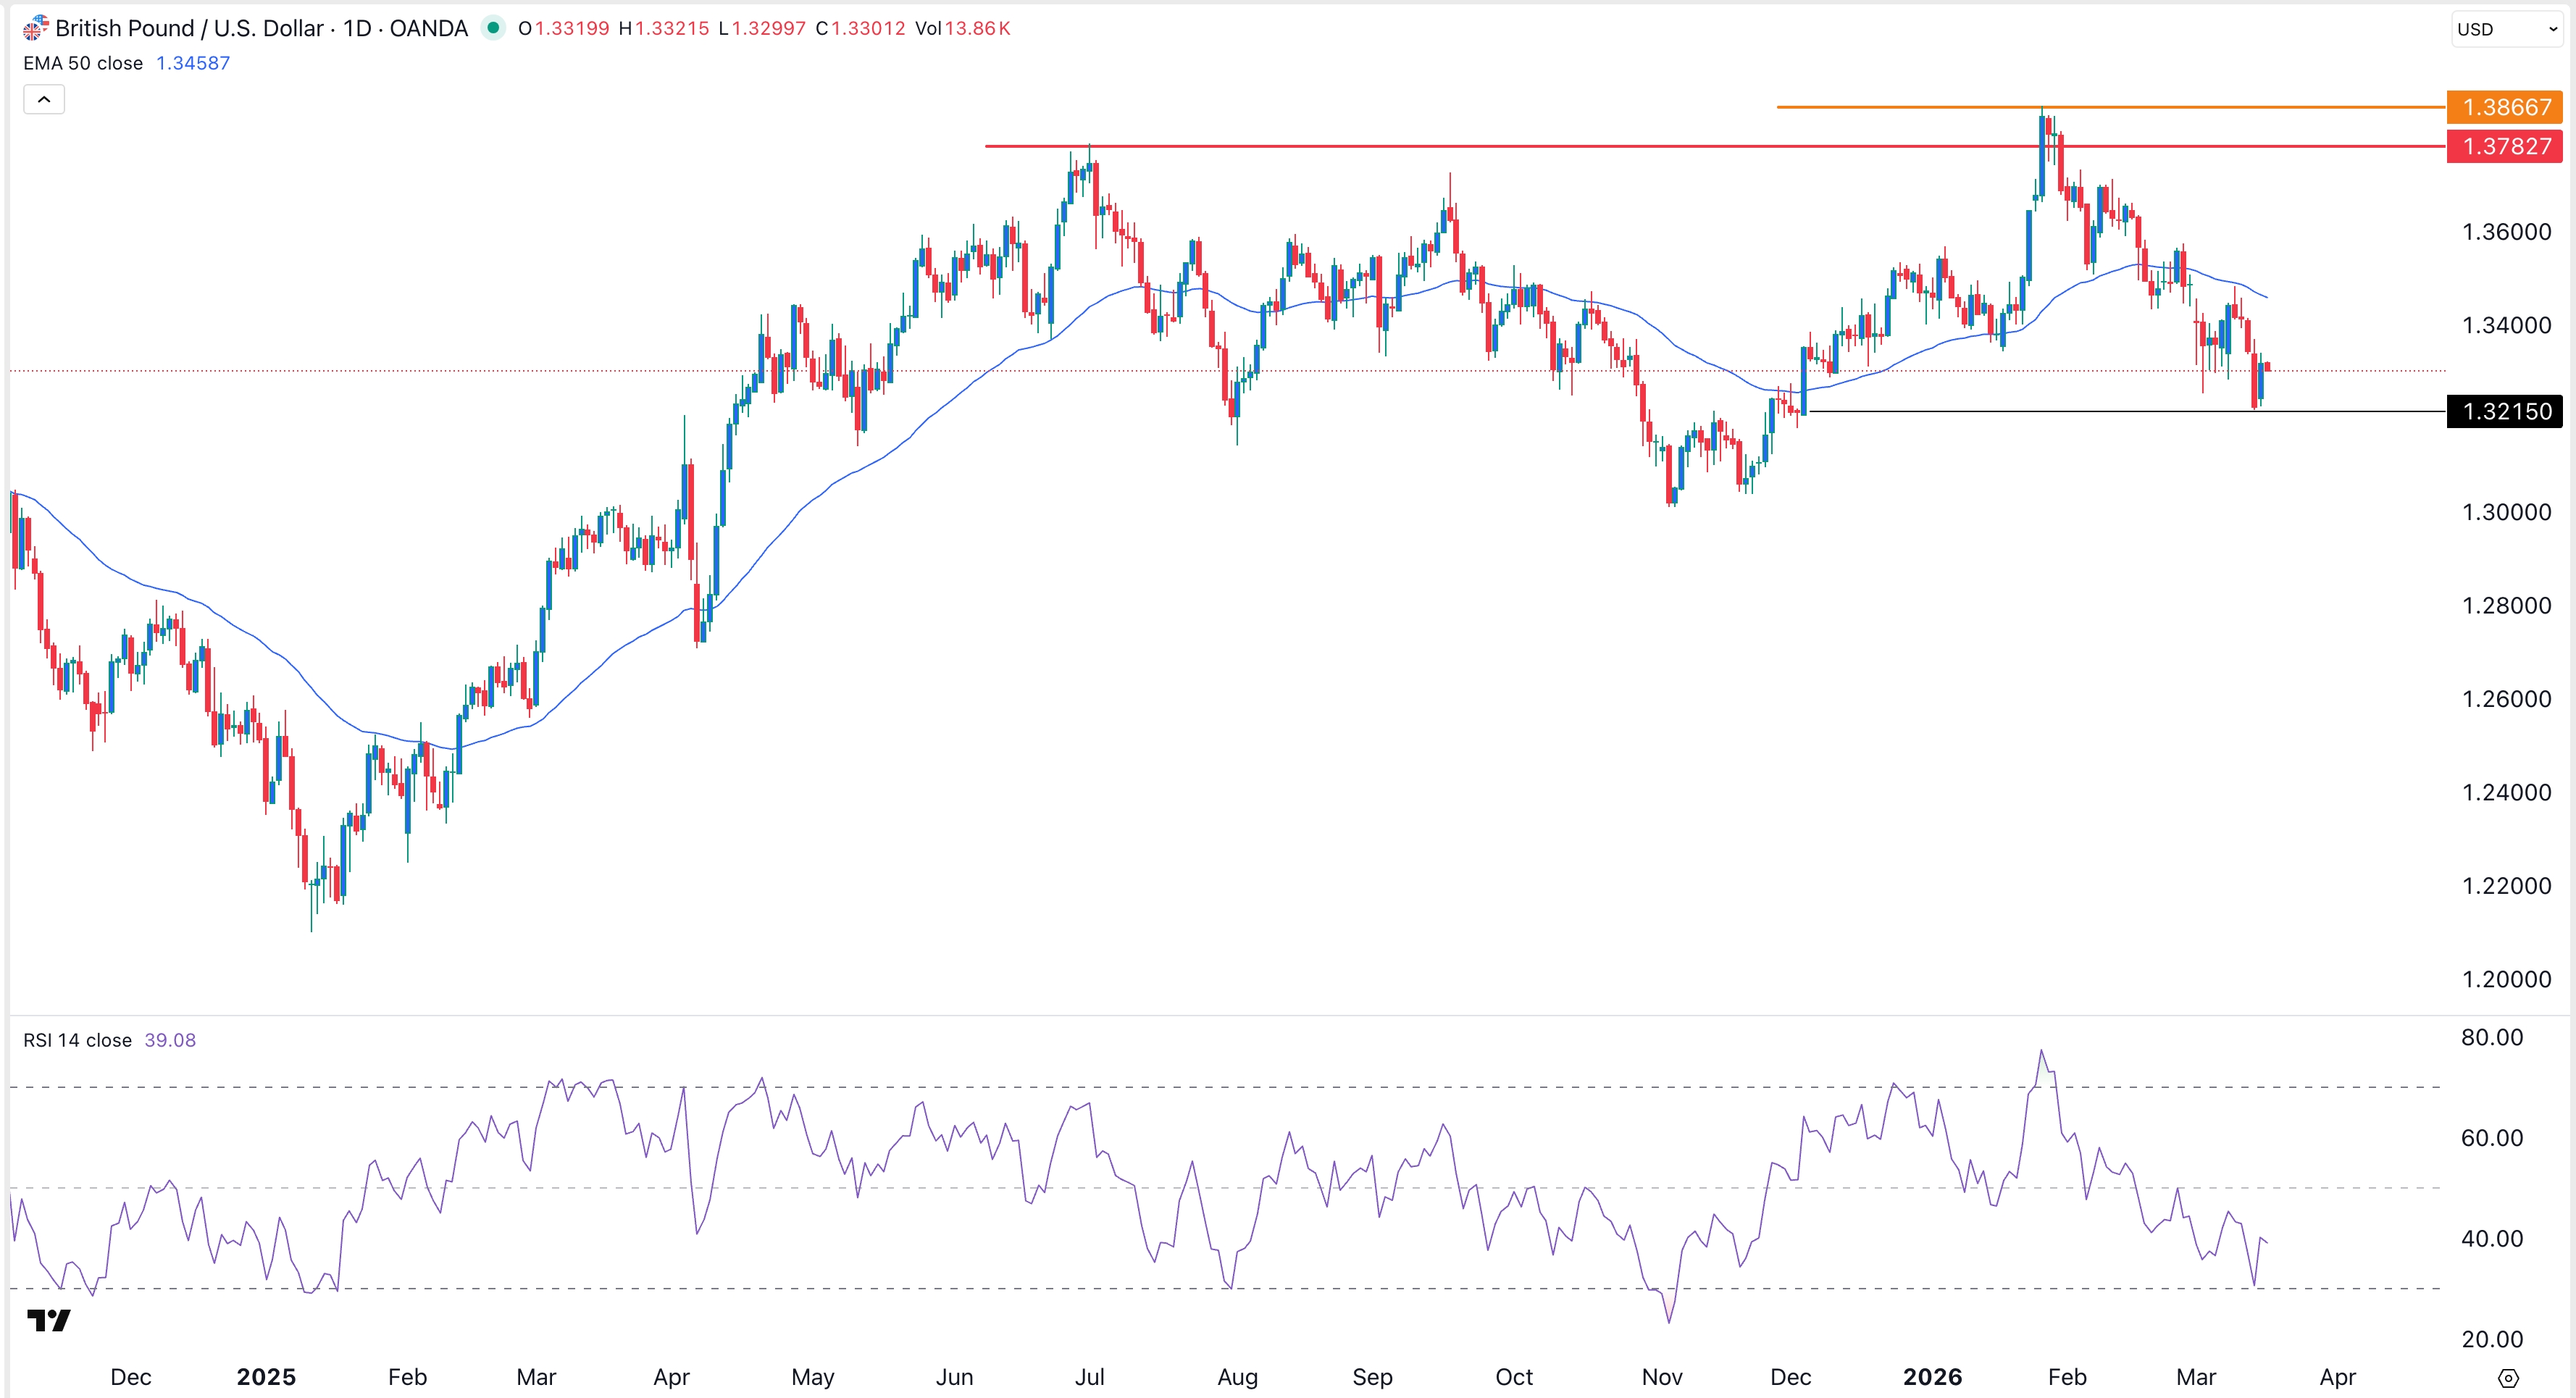
GBP/USD Technical Analysis
The daily timeframe chart shows that the GBP/USD pair remained in a narrow range in the past few weeks. It remained inside the support and resistance levels at 1.3475 and 1.3595.
The pair has remained above the 50-day and 100-day Exponential Moving Averages (EMA). It has also formed a bullish flag pattern, while the Relative Strength Index (RSI) and the Percentage Price Oscillator (PPO) have continued soaring.
Therefore, the pair will likely have a strong bullish breakout, potentially to the next key resistance level at 1.3800. On the other hand, a move below the support at 1.3474 will invalidate the bullish outlook and point to more downside.