
My previous BTC/USD signal last Monday gave a profitable long trade on the bullish breakout beyond $80,469.
Today’s BTC/USD Signals
Risk 0.50% per trade.
Trades must be taken prior to 5pm Tokyo time Friday.
Long Trade Ideas
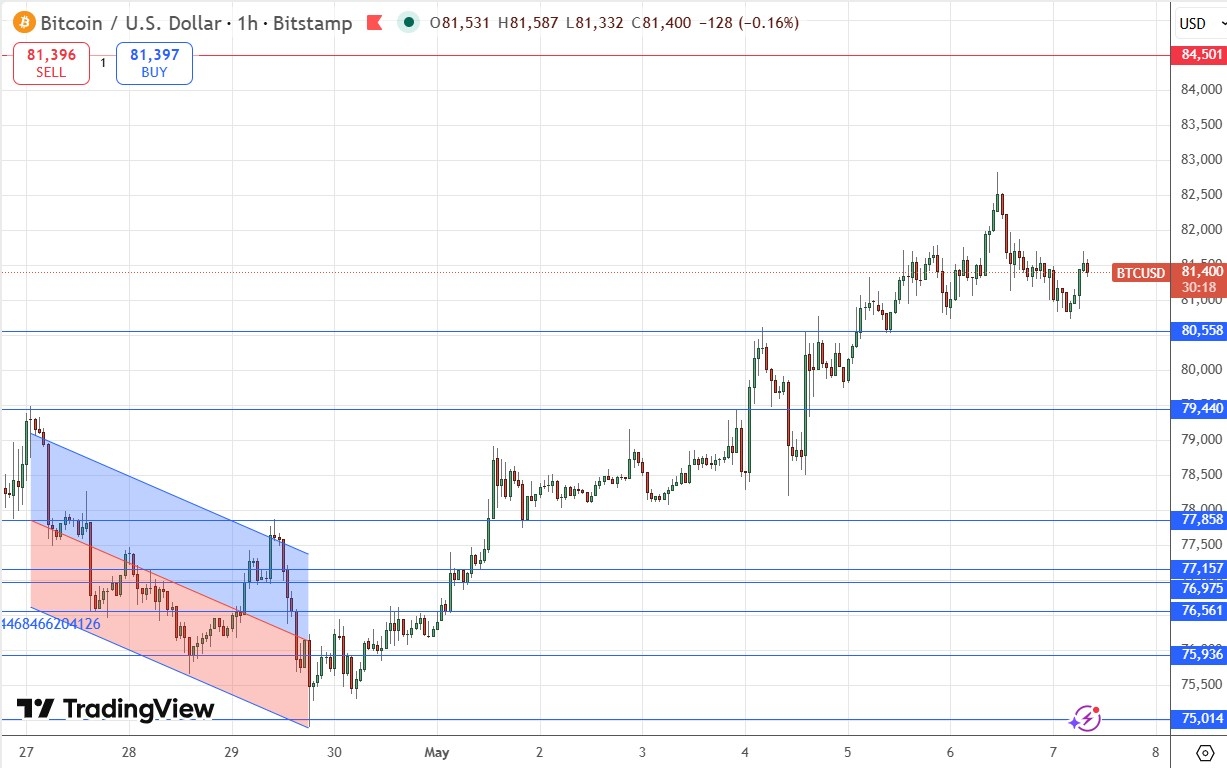
Go long after a bullish price action reversal on the H1 timeframe following the next touch of $80,558, $79,440, or $77,858.
Place the stop loss $100 below the local swing low.
Move the stop loss to break even once the trade is $100 in profit by price.
Take off 50% of the position as profit when the trade is $100 in profit by price and leave the remainder of the position to ride.
Short Trade Ideas
Go short after a bullish price action reversal on the H1 timeframe following the next touch of $84,501.
Place the stop loss $100 above the local swing high.
Adjust the stop loss to break even once the trade is $100 in profit by price.
Take off 50% of the position as profit when the trade is $100 in profit by price and leave the remainder of the position to ride.
The best method to identify a classic “price action reversal” is for an hourly candle to close, such as a pin bar, a doji, an outside or even just an engulfing candle with a higher close. You can exploit these levels or zones by watching the price action that occurs at the given levels.
BTC/USD Analysis
In my last BTC/USD forecast last Monday, I thought that a bullish breakout above the new resistance level at $80,469 would probably be a good signal to enter a long trade, as this level seemed pivotal.
The level was indeed pivotal, catching the bearish reversal, so I was correct in that sense, and the bullish breakout beyond it did not happen until the Asian session, so the long trade could have been taken profitably then.
We have seen the price clear resistance and get bullishly established in a zone that is above several resistance levels, but well below the nearest key resistance level. This means that the price has room to rise and there are no obstacles stopping bulls from pushing the price higher.
Despite the bull-friendly technical picture, it is worth noting that the bullish price action we are seeing over recent hours is not much compared to what we are seeing in stock markets. When Bitcoin is hot, it rises even more aggressively than a booming stock index. So, I think something is a little off here, even though we are seeing recently a new multi-month high price.
Nevertheless, a long trade still looks better than a short one, and I see a long trade entry following another test and bullish bounce off the nearest support level at $80,558 as potentially having a great reward to risk ratio, with all the room before a resistance level is reached.
That support level is also confluent with a major round number at $80,000.
https://www.tradingview.com/chart?symbol=COINBASE%3ABTCUSD
There is nothing of high importance due today regarding either Bitcoin or the US Dollar.
Ready to trade our free Forex signals? Here is our list of the best MT4 crypto brokers worth checking out.