
Top Regulated Brokers
The BTC/USD pair has produced some fantastic, highly tradable and relatively technically predictable sizable price movements in recent years, giving investors and especially traders some great opportunities to profit.
Naturally, traders are looking to Bitcoin in the hope it will produce more such major moves in the future. However, Bitcoin’s recent rise to a new multi-month high had less energy and momentum in it than stock markets and certain other “risk” assets did at the same time. This, combined with the disappearance of the recent bullish momentum, is leading many to wonder if the shine has come off Bitcoin, permanently or at least semi-permanently.
The major reason why the action here in Bitcoin might have reached a tipping point worth paying attention to, is that a zoomed-in technical analysis of the price chart shows bulls and bears are very evenly balanced. Typically, when this is the case with a narrowing consolidation, which is what is dominating the chart now, the price is forced to break out of the narrowing, which can then trigger a more decisive directional movement like a trend resumption or a trend change.
Other factors putting Bitcoin in focus right now are:
Indecisive price action in the USD, suggesting movements here will be driven mostly by Bitcoin;
Today’s US CPI (inflation) data might give a surprising result and trigger a directional movement.
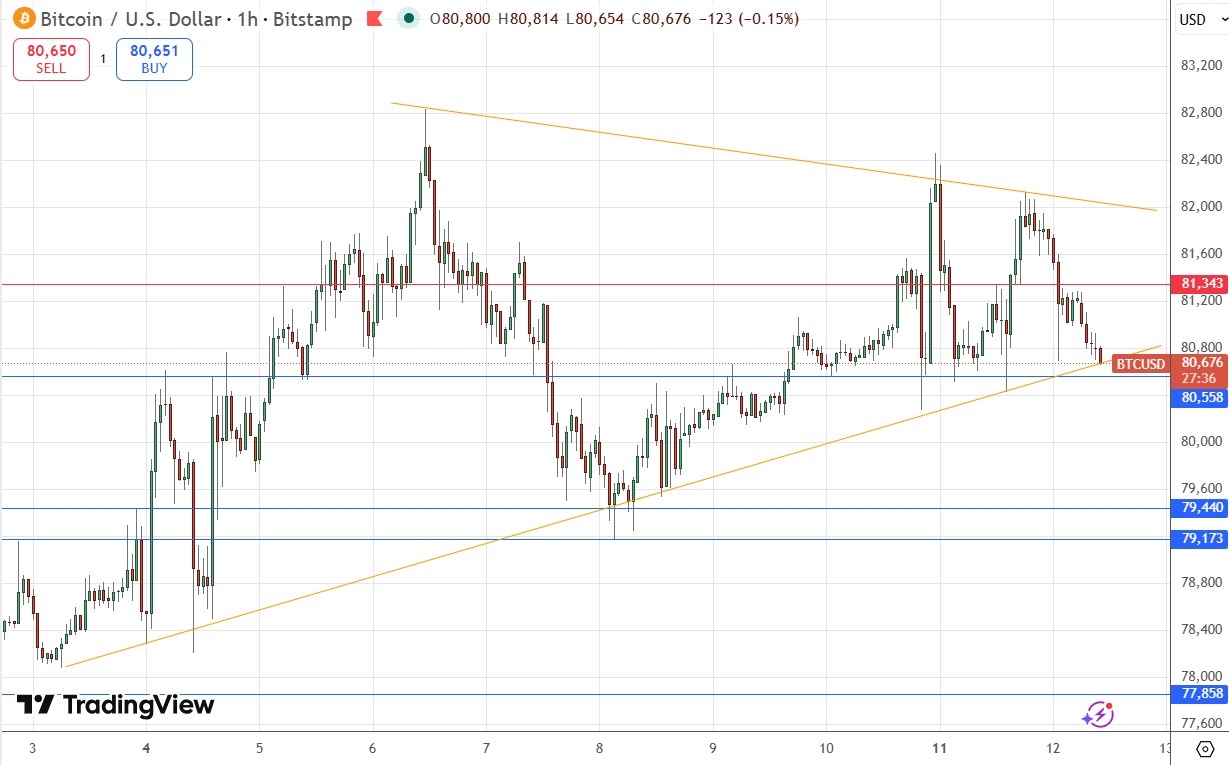
The major evidence that Bitcoin is coming to a decisive moment is the narrowing triangle chart pattern which has formed, shown within the price chart below with the two trend lines joining the highs and lows respectively. They form a narrowing triangle pattern, which is seen as manifesting indecision and a potential breakout on either side of the triangle.
Although the price is certainly contained within a narrowing triangle and has been for several days, it is not the best indecisive triangle – the best ones are usually very even and symmetrical in every way, and this one is not – the ascending trend line is steeper than the descending one.
Another technical factor worth paying attention to is that although the long-term bullish trend is a bit weak here, there is a meaningful bullish trend with recent new multi-month highs. This could strengthen the case for a bullish breakout if we get one, especially if the price clears the three swing highs and gets established above $82,500.
AUD/USD Technical Analysis
The major evidence that Bitcoin is coming to a decisive moment is the narrowing triangle chart pattern which has formed, shown within the price chart below with the two trend lines joining the highs and lows respectively. They form a narrowing triangle pattern, which is seen as manifesting indecision and a potential breakout on either side of the triangle.
Although the price is certainly contained within a narrowing triangle and has been for several days, it is not the best indecisive triangle – the best ones are usually very even and symmetrical in every way, and this one is not – the ascending trend line is steeper than the descending one.
Another technical factor worth paying attention to is that although the long-term bullish trend is a bit weak here, there is a meaningful bullish trend with recent new multi-month highs. This could strengthen the case for a bullish breakout if we get one, especially if the price clears the three swing highs and gets established above $82,500.
(image12052026btcusd)
Watch Out for US CPI (Inflation) Data
The major risk in trading pairs involving the US Dollar such as this one today is that there will be a release of a potentially extremely high-impact economic data point: US CPI (inflation) data. This is usually the most important data point each month in the calendar of the Forex market.
The danger of this data release is that if it deviates from the consensus forecast of a rise from an annualised rate of 3.3% to 3.7%, it will likely impact the relative value of the US Dollar. For example, if it comes in at 3.9% or above, the price of this currency pair will move notably lower right away. If it comes in at 3.5% or below, the price of this currency pair will move notably higher.
When there is surprising economic data, technical factors can become quickly irrelevant.
Could the Triangle Become Irrelevant?
My analysis today is based on seeing a breakout from the triangle chart pattern as likely to produce a decisive (or at least profitable) move in the price. Yet there are reasons to think that this may not necessarily be the pivotal technical event of today’s prices in Bitcoin.
There is a bullish trend and if you trade only with the trend or at least fear the trend, a breakdown from the triangle might be a fake move which is quickly reversed.
The triangle, as already mentioned, does not look especially strong, so I do not have very strong faith in it.
A surprise in the US CPI (inflation) data due today, or in the conflict between the USA or Iran, could send the price right through technical features like the triangle,
My Take on BTC/USD
The thing to watch here today is likely going to be which direction the price breaks out of the narrowing triangle first. The first trend line reached will probably be today’s pivotal point. If we get a strong bullish bounce at the first test of the ascending trend line, a long trade will likely be a good opportunity, especially if a support level ($80,558) is also rejected at the same time; a bearish rejection of the upper trend line could set up a good short trade, especially if the round number at $82,000 is rejected simultaneously with that.
Review, Support & Resistance Levels h2
My previous BTC/USD signal last Thursday gave a profitable long trade from $79,400.
Today’s BTC/USD Signals
- Risk 0.50% per trade.
- Trades must be taken prior to 5pm Tokyo time Wednesday.
Long Trade Ideas
Go long after a bullish price action reversal on the H1 timeframe following the next touch of $80,558, $79,440, or $77,858.
Place the stop loss $100 below the local swing low.
Move the stop loss to break even once the trade is $100 in profit by price.
Take off 50% of the position as profit when the trade is $100 in profit by price and leave the remainder of the position to ride.
Short Trade Ideas
Go short after a bullish price action reversal on the H1 timeframe following the next touch of $81,343.
Place the stop loss $100 above the local swing high.
Adjust the stop loss to break even once the trade is $100 in profit by price.
Take off 50% of the position as profit when the trade is $100 in profit by price and leave the remainder of the position to ride.
The best method to identify a classic “price action reversal” is for an hourly candle to close, such as a pin bar, a doji, an outside or even just an engulfing candle with a higher close. You can exploit these levels or zones by watching the price action that occurs at the given levels.
There is nothing of high importance scheduled today concerning Bitcoin. Regarding the US Dollar, there will be a release of CPI (inflation) data at 1:30pm London time, followed by the Fed Chair vote later.
Ready to trade our free Forex signals? Here is our list of the best Forex brokers in the world worth reviewing.