
Top Regulated Brokers
Traders are looking to Bitcoin in the hope it will produce more of its spectacular price movements as new major moves in the future. Bitcoin’s recent rise to a new multi-month high within the past few weeks had less energy and momentum in it than stock markets and certain other “risk” assets did at the same time, but it still got bulls excited. However, the lack of follow through by bulls, and the emergence of a bearish technical pattern which is dominating the price chart, is calling the bullish dream of new highs into serious question. Traders looking for a larger bearish move to exploit with a short trade are starting to wonder if their time has come.
The major reason why the action here in Bitcoin might have reached a bearish tipping point worth paying attention to, is that the bears have got the upper hand with a short-term or even medium-term trend change. I’ll get into the details of the technical evidence for this later, but right now it is enough to know that it looks quite strong.
Other factors putting Bitcoin in focus right now are:
Indecisive price action in the USD, suggesting movements here will be driven mostly by Bitcoin;
Today’s US Retail Sales data might give a surprising result and trigger a directional movement.
The fact that US stock markets, which have historically been positively correlated with Bitcoin, are rising firmly to new record highs, while Bitcoin can’t even get established at a new multi-month highs is suggestive of a bearish differential.
BTC/USD Technical Analysis
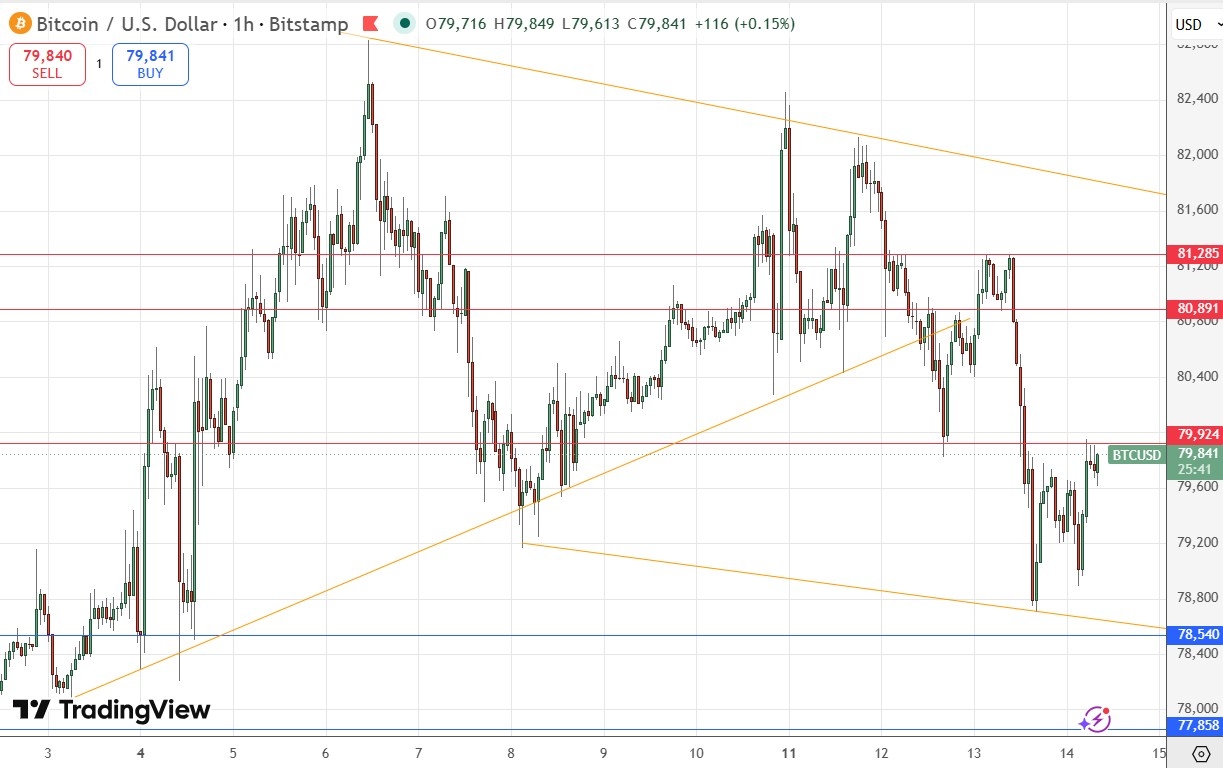
The major evidence that Bitcoin is coming to a more decisively bearish moment is the new descending price channel which is gripping the price and sending it lower. In the price chart below, I have drawn it both manually with freestyle trend lines, and I have also used a linear regression analysis.
This bearish price channel is quite new and wide, but the fact that is symmetrical is suggestive that it will be a strong pattern likely to affect the price.
The price action has printed new, lower resistance levels within the price channel as the price has moved lower, showing more bearish pressure and giving more weight to the bearish case. This is further supported by the ascending supportive trend line breaking down as the price moved lower. The price is also looking quite heavy near the low of the price channel.
The failure of the price to make impressive new highs while major stock markets are doing so suggest something is off with Bitcoin and that it will be prone to a move lower.
(image14052026btcusd)
Watch Out for Institutional or Regulatory Crypto Announcements
The major risk in going short of Bitcoin now lies in Bitcoin itself. There is high-impact data due concerning the US Dollar today (retail sales) which could move the price higher if there is a major surprise in this data to the upside, but this is relatively minor.
The big risk is that some kind of regulatory change or institutional increased interest or commitment to Bitcoin could be announced. There are always traders and investors willing to buy Bitcoin on the dips or as it rises, similar in approach to a meme stocks. So, when institutional or regulatory news comes out that has a bullish effect, it can trigger a stampede of buying. When this happens, anyone who is short will be on the wrong side of the trade.
There is a long-term bullish trend, and this can make a short trade more dangerous, as the trend might reassert itself.
Case for a Long Trade
Although I am looking for a short trade, ideally from a failed retest of $79,924 which includes a rejection of the round number at $80,000, and I see the bearish price channel as likely to give bears the edge, it might be that the best opportunity which will set up here today could be a long trade.
Note in the price chart above how the horizontal support level at $78,540 looks both strong as a flipped “stairstep” level over recent days, but it is also becoming very confluent with the lower trend line of the bearish price channel.
I will enter a long trade here if we get a strong bullish bounce at the first touch of $78,540 if it also rejects the trend line. If beyond that it also bounces off $77,500 that would make the bullish case even stronger.
My Take on BTC/USD
The thing to watch here today is likely going to be whether the price first reaches $79,924 or $78,540. I see a short trade from the higher level as a better potential opportunity but don’t rule out a long trade from $78,540 in line with the long-term trend. Of course, there are often counter-trend opportunities within trend, and this could be one of them. Bitcoin has not provided the kind of huge price movements that it used to though, and as it matures away from the hype, is starting to behave more like any asset that isn’t necessarily going to the moon.
Review, Support & Resistance Levels
My previous BTC/USD signal last Tuesday was not triggered, but I was correct about an initial bearish breakdown from the triangle chart formation being a bearish sign, as the price has moved lower from there.
Today’s BTC/USD Signals
Risk 0.50% per trade.
Trades may only be entered by 5pm Tokyo time Friday.
Long Trade Ideas
Go long after a bullish price action reversal on the H1 timeframe following the next touch of $78,540, $77,858, or $77,157.
Place the stop loss $100 below the local swing low.
Move the stop loss to break even once the trade is $100 in profit by price.
Take off 50% of the position as profit when the trade is $100 in profit by price and leave the remainder of the position to ride.
Short Trade Ideas
Go short after a bullish price action reversal on the H1 timeframe following the next touch of $79,924, $80,891, or $81,825.
Place the stop loss $100 above the local swing high.
Adjust the stop loss to break even once the trade is $100 in profit by price.
Take off 50% of the position as profit when the trade is $100 in profit by price and leave the remainder of the position to ride.
The best method to identify a classic “price action reversal” is for an hourly candle to close, such as a pin bar, a doji, an outside or even just an engulfing candle with a higher close. You can exploit these levels or zones by watching the price action that occurs at the given levels.
There is nothing of high importance scheduled today concerning Bitcoin. Regarding the US Dollar, there will be a release of Retail Sales data at 1:30pm London time.
Ready to trade our daily crypto signals? Here is our list of the best MT4 crypto brokers in the world worth checking out.