
Fundamental Analysis & Market Sentiment
I wrote on 29th March that the best trades for the week would be:
Long of the USD/JPY currency pair. This gave a loss of 0.40%.
Long of the 10Y US Treasury Yield Future. This gave a loss of 2.99%.
That week’s overall loss of 3.39% is 1.70% per asset.
A summary of last week’s most important data in the market:
US CPI – the annualized rate came in at 3.3%, a tick below the widely expected 3.4%.
US ISM Services PMI – this was just a tiny bit worse than expected.
US Core PCE Price Index – as expected.
US Final GDP – revised downwards again, from a quarterly rate of 0.7% to 0.5%.
US FOMC Meeting Minutes – there were no real surprises, but the minutes tended to reinforce generally hawkish sentiment on rates.
RBNZ Policy Meeting – no surprises.
Canada Unemployment Rate – just a tick better than expected, at 6.7%.
Last week’s economic data releases were much less influential upon the markets than the US/Iran ceasefire was. The mere fact that the USA and Iran are talking, despite the enormous gaps in their continued understanding of the terms of the ceasefire, let alone between their respective red lines, has produced a more risk-on market environment, especially concerning energy prices. As the talks have concluded with a generally downbeat reading of a USA very firm on certain demands and an equally firm Iran refusing to grant them – wishing to maintain both nuclear enrichment and to control, formally, passage through the Strait of Hormuz – we can probably expect markets to open in a more risk-averse mood, especially in stock markets and in energies. VP Vance departing stated “Bad news… the Iranian have decided not to accept our terms.”
Prediction markets generally think that this war will end within the next few weeks with some kind of formal agreement between the USA and Iran. This suggests that the crowd might be overly optimistic, paving the way for a potential surprise to the downside if hostilities suddenly resume. It remains very difficult to see how the nuclear and Hormuz issues, let alone Lebanon, can be resolved in a way all parties would find saleable to their constituencies.
The Week Ahead: 13th – 17th April
The middle east war is likely to remain more influential that any economic data releases which are scheduled over the coming week, as we approach the deadline for the expiry of the current two-week ceasefire and await to see whether it will be extended or something else will be agreed.
The coming week’s most important data points, in order of likely importance, are:
US PPI
UK GDP
Australia Unemployment Rate
Monthly Forecast April 2026
Currency Price Changes and Interest Rates
For the month of April, I forecasted that the USD/JPY currency pair would rise in value.
Currency Pair | Forecasted Direction | Interest Rate Differential | Performance to Date |
USD/JPY | Long ↑ | +3.00% (3.75% - 0.75%) | +0.34% |
Weekly Forecast 13th April 2026
Last week saw three currency crosses with excessive volatility, so I made the following forecasts for the coming week:
AUD/JPY short
NZD/JPY short
NZD/CAD short
The Australian Dollar was the strongest major currency last week, while the US Dollar was the weakest.
Next week’s volatility is likely to decline a bit. However, the ongoing war in the Middle East (subject to the current ceasefire) retains the ability to roil the market if there are any surprises. This could generate volatility in the US Dollar, the Japanese Yen, and the Canadian Dollar, not to mention stock markets.
You can trade these forecasts in a real or demo Forex brokerage account.
Technical Analysis
Key Support/Resistance Levels for Popular Pairs
Currency Pair | Key Support / Resistance Levels |
AUD/USD | Support: 0.7026, 0.7002, 0.6982, 0.6963 Resistance: 0.7100, 0.7213, 0.7248, 0.7275 |
EUR/USD | Support: 1.1718, 1.1678, 1.1669, 1.1640 Resistance: 1.1750, 1.1792, 1.1810, 1.1840 |
GBP/USD | Support: 1.3453, 1.3408, 1.3371, 1.3314 Resistance: 1.3477, 1.3504, 1.3536, 1.3549 |
USD/JPY | Support: 158.63, 158.46, 157.99, 157.30 Resistance: 159.38, 159.73, 159.96, 161.55 |
AUD/JPY | Support: 112.37, 111.28, 111.02, 110.60 Resistance: 112.90, 113.18, 113.37, 114.00 |
EUR/JPY | Support: 186.54, 186.23, 185.88, 184.85 Resistance: 187.00, 188.00, 189.00, 190.00 |
USD/CAD | Support: 1.3797, 1.3772, 1.3754, 1.3731 Resistance: 1.3845, 1.3860, 1.3876, 1.3899 |
USD/CHF | Support: 0.7838, 0.7800, 0.7700, 0.7600 Resistance: 0.7897, 0.7928, 0.7958, 0.7980 |
Key Support and Resistance Levels
US Dollar Index
The US Dollar printed a large bearish candlestick, with no significant lower wick, and a close that was very near to the low of its range. These are bearish signs. However, we have mixed long-term trends, with the 3-month trend bullish and the 6-month trend bearish. Looking at the price chart below, we can see that the greenback is really within a long-term consolidation phase, so we cannot really expect much of a trend in the US Dollar here.
I think the greenback will be more driven by the progress in the current Middle East ceasefire – if war breaks out again, it will likely boost the Dollar, not so much as a haven but more as an effect of the inflationary shock of the rising energy prices. If the ceasefire becomes something more durable, conversely, it will probably be bearish for the US Dollar.
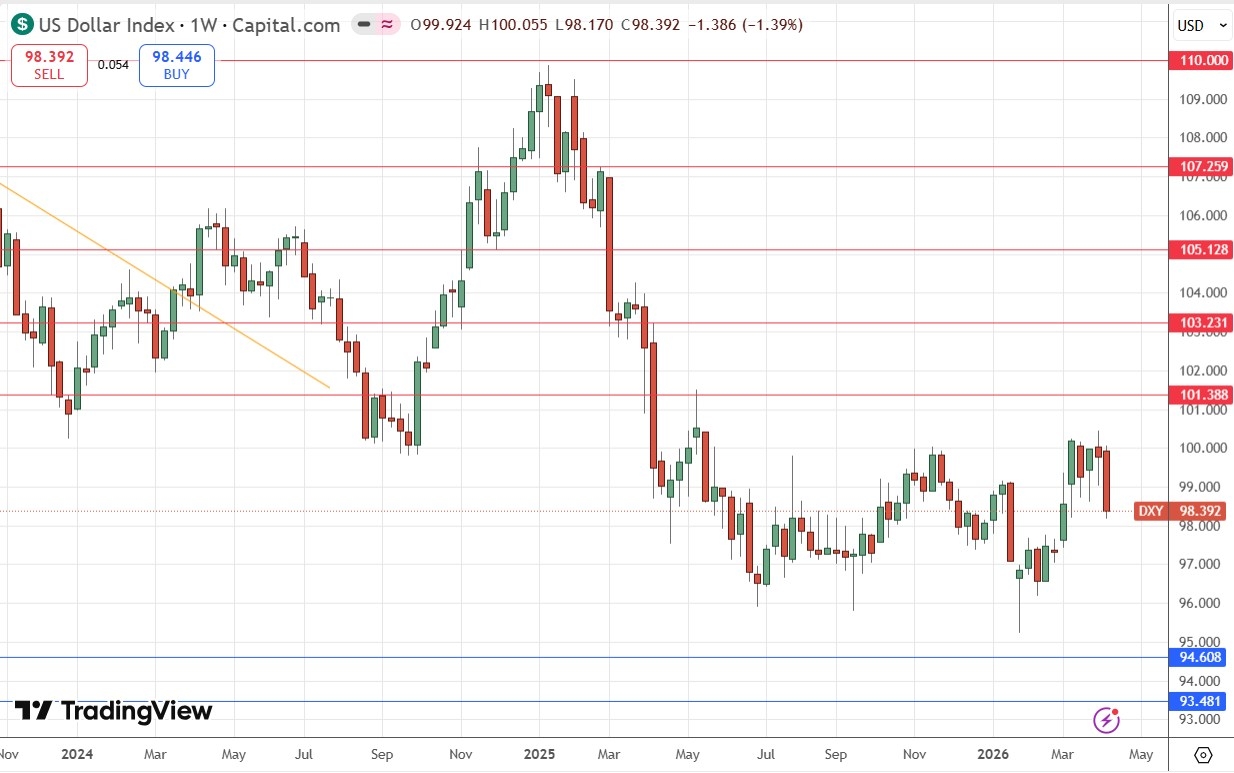
US Dollar Index Weekly Price Chart
AUD/USD
The AUD/USD currency pair was at the heart of the Forex market again last week, with the Aussie gaining by more than any other major currency, while the US Dollar was the biggest lower. There has been a very long-term bullish trend in the Aussie, which seemed to have decoupled from risk sentiment to some extent, but we see the Aussie getting bid hard as the world enjoys the current ceasefire in the Middle East war, mostly hoping that this will somehow lead to a more durable peace agreement between the USA and Iran, although it is hard to see how the gaps can be bridged in the negotiations.
Looking technically at the weekly price chart below, we see that we saw a strong rise last week that ran out of momentum as it approached the major resistance level, confluent with a round number, at $0.7200. This looks a bit overbought, and we might get a short trade opportunity here if we continue to see failure near or at $0.7200, especially if sentiment turns more downbeat on the prospects for the ceasefire after talks between the USA and Iran in Pakistan just ended with no agreement.
This pair will likely be at the heart of market volatility, which can be great for day traders, and follow sentiment on the Middle East and the second order effect of a commodity price shock, both up and down.
The Aussie is also notably overbought against the Japanese Yen.
I won’t be trading in this currency pair yet, but day traders might want to look for shorts in this currency pair if we see a bearish reversal price action set up at $0.7200.
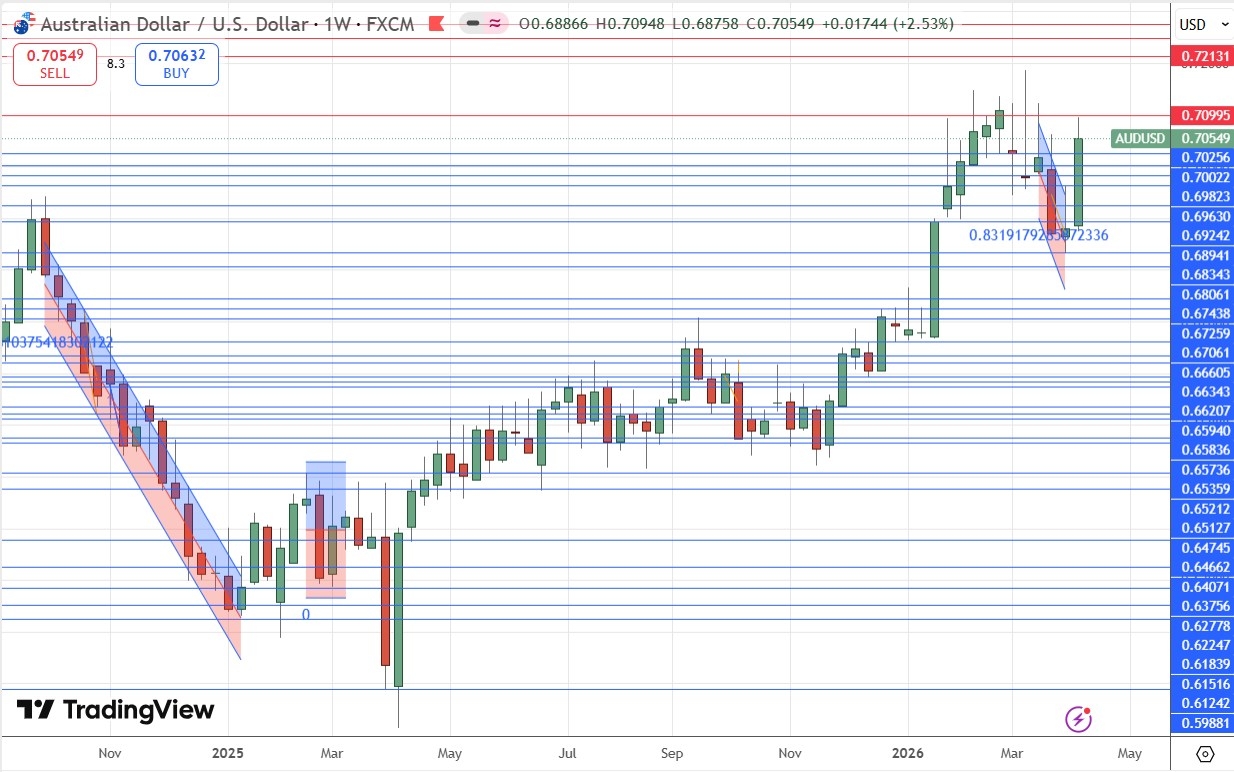
AUD/USD Weekly Price Chart
USD/JPY
The USD/JPY currency pair lost a little ground last week, two weeks after finally making the long-anticipated bullish breakout beyond the big round number at ¥160. The problem is not Yen weakness, which can be taken for granted over the long-term it seems. The problem for progress higher by this currency pair is the renewed weakness in the US Dollar now that there is a ceasefire in the Middle East war, because if there is a longer-term agreement it would remove some inflationary pressure from the Fed through lower energy prices.
I am happy to be long of this currency pair, although I would be more comfortable in my long trade if the price was established comfortably above ¥160.
If we do not see the price up there soon, I fear that we might have a bit of a bearish head and shoulders chart pattern which might complete below ¥157.50.
More cautious traders might want to wait for a daily (New York) close above ¥160 before entering a new long trade.
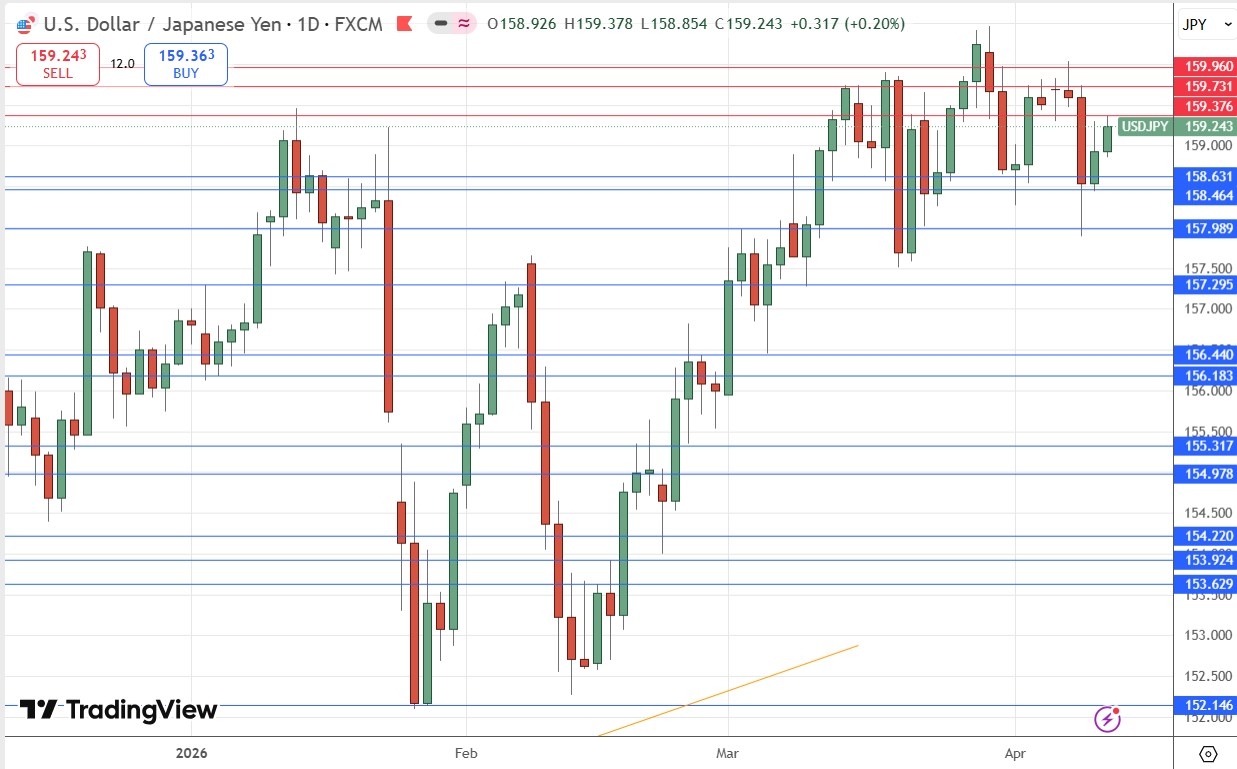
USD/JPY Daily Price Chart
Brent Crude Oil Futures
Brent Crude Oil gapped lower quite dramatically early last week following President Trump’s announcement of a 2-week ceasefire in the war with Iran, which had been looking likely to escalate into all-out war on economic targets, including energy targets. This was pushing the price of crude oil higher, but we really saw the price drop as investors dare to hope to some kind of peaceful compromise to end the crisis, although it is very hard to imagine how this would be agreed.
It can be said that the price is just consolidating and not falling further.
With the talks between an Iranian delegation and US Vice-President Vance breaking down a few hours ago in Pakistan with both sides expressing disappointment, we might start to see the price of crude oil look more bullish as the new week opens, as analysts might begin to see increasing risk of the ceasefire collapsing soon, or at least an increasing chance that no agreement will be forthcoming before the current ceasefire expires on 21st April.
Although I find some kind of bullish price action is likely over the coming days, I will only want to be long of Crude Oil again if we get a new long-term high in the closing end of day price.
If you are going long, Brent will likely be the better vehicle than WTI, as it is more exposed to events in the Strait of Hormuz.
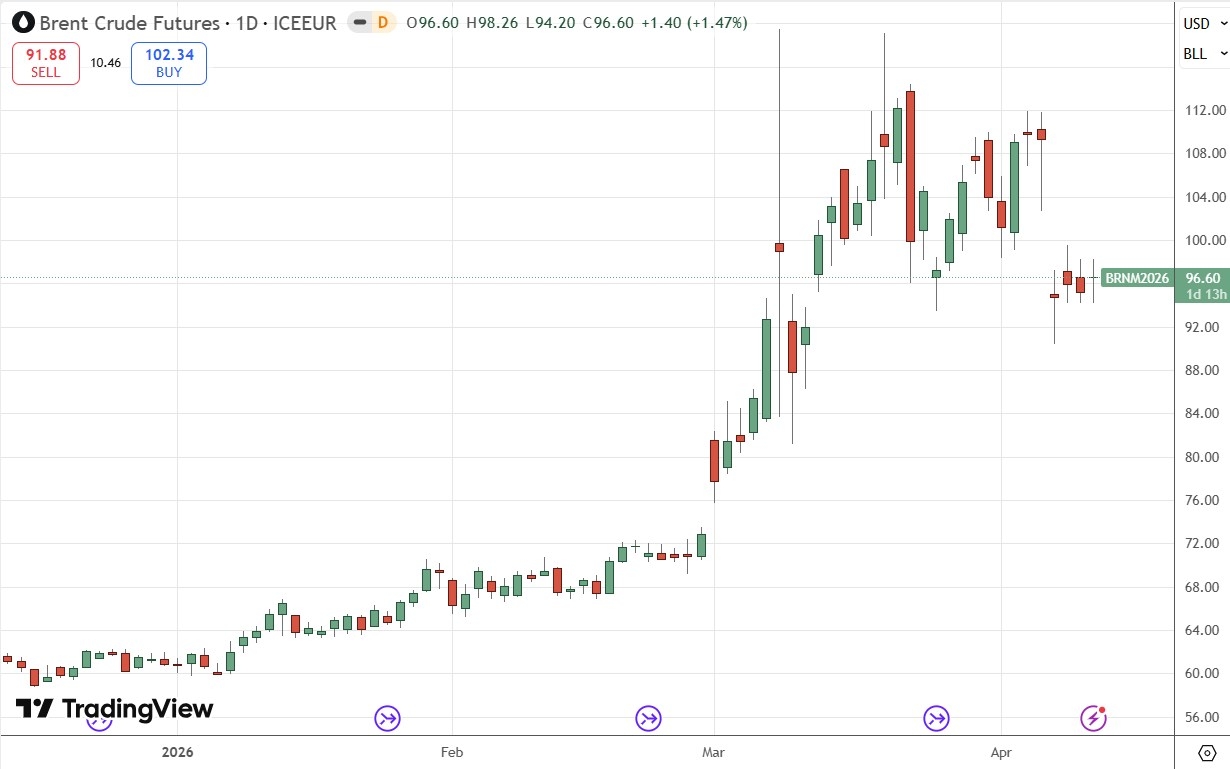
Brent Crude Oil Futures Daily Price Chart
Bottom Line
I see the best trades this week as:
Long of the USD/JPY currency pair following a daily (New York) close above ¥160.
Long of Brent Crude Futures in the unlikely event we get a daily close above $112.50.
Ready to trade our Forex weekly forecast? Check out our list of the top 10 Forex brokers.