
TRX is trading around $0.33 today, up roughly 1.6% on the week, with daily volume near $756 million and market cap holding above $31 billion.
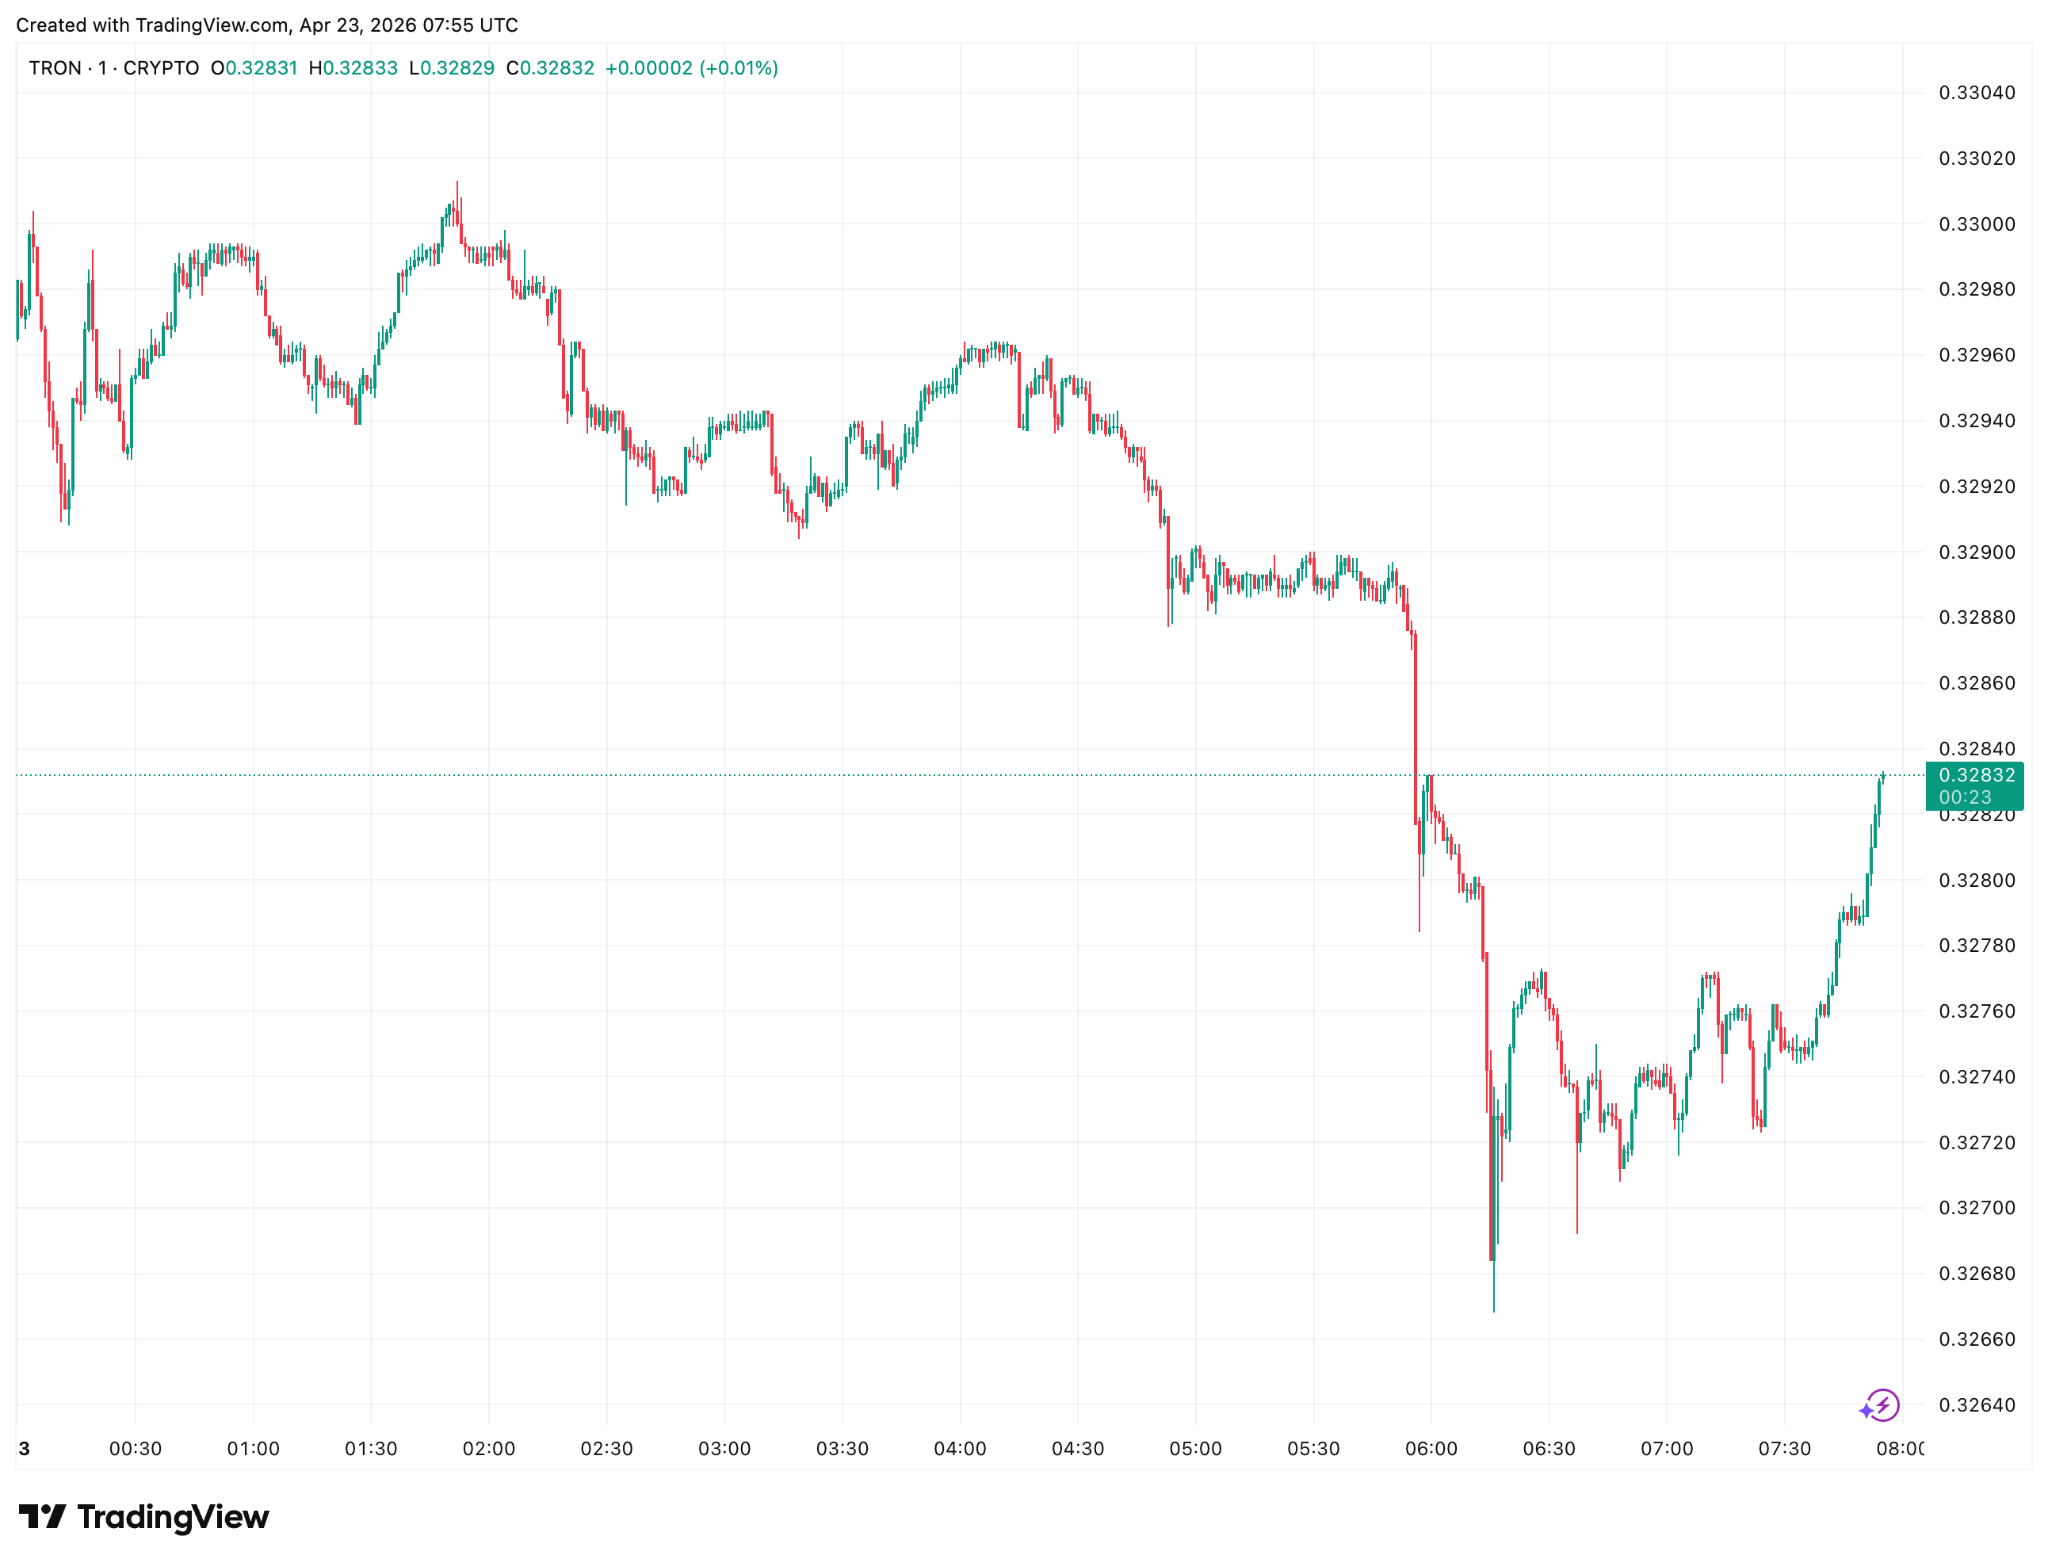
Tron Price Chart | Source: TradingView
TRX Tests Channel Resistance
The last 30 days have produced only 13 green sessions, and volatility has compressed below 2%. That's a coiled setup. Either the channel breaks clean to the upside and opens a path toward the mid-$0.30s, or the compression resolves through a pullback to retest the lower boundary near $0.31.
Moving Averages Split the Timeframes
The moving average picture tells two different stories depending on where you're looking. On the 4-hour chart, both the 50 and 200 are rising, with the longer MA turning up on April 17. That's the kind of structure that keeps short-term trend traders long.
Meanwhile, the 50-day sits below the price and slopes up, which is fine. But the 200-day has been falling since March 23, which means longer-term trend followers are still waiting for confirmation. Until that 200-day flattens and turns up, any breakout will likely get sold into by systematic funds.
RSI Flashes an Overbought Warning
The daily RSI reading is 73.7, which technically puts TRX in overbought territory. That doesn't automatically mean a top.
Strong trends can run with RSI pinned above 70 for extended stretches. But anyone chasing here needs to be honest about reward-to-risk, which gets worse the higher RSI climbs without a cool-off.
Upside Targets If the Channel Breaks
A daily close above $0.335 clears the immediate resistance cluster and puts $0.35 in play. That's the level where TRX stalled multiple times through 2025 before rolling over, so it's the real gate to any extended move.
Beyond that, the $0.37 region (the 2025 high) becomes the next magnet. A push through $0.37 with volume would put the all-time high at $0.4392 back on the table, which, from current levels, means roughly 32% upside. Solid for a top ten asset, but it also defines the ceiling.
Downside Levels and Invalidation
First support sits at $0.3125, about 4% below the current price, and lines up with the channel's rising lower boundary. Losing that on a daily close breaks the ascending structure and opens the door to $0.3036 and then $0.295.
A break below $0.295 invalidates the entire March to April bull structure and would likely send TRX back toward the $0.278 range, where this leg started. For anyone trading the breakout, that's the hard stop.
Fundamentals Backing the Chart
The backdrop has rarely been this supportive. TRON generated $82.2 million in protocol fees in Q1 2026, second only to Hyperliquid across all major chains. The network carries over $85 billion in USDT and processed $2 trillion in stablecoin transfers during the quarter.
Daily active addresses hit 3.2 million. April added a post-quantum cryptography initiative, a Binance.US listing on the 17th, and a live TRX ETF filing from Canary Capital with staking attached.
Whether this setup resolves with a clean breakout probably comes down to ETF news flow through the rest of April and whether the $0.335 ceiling finally gives way on a daily close.
We hope you enjoyed reading our analysis of Tron. If you’d like to trade with one of the best crypto CFD brokers, check out our list.