
Long Trade Idea
Enter your long position between $182.28 (the lower band of its horizontal resistance zone) and $188.00 (the upper band of its horizontal resistance zone).
Market Index Analysis
RTX Corporation (NYSE:RTX) is a member of the S&P 100 Index and the S&P 500 Index.
Both indices are recording lower highs and lower lows, hinting at further potential weakness.
The Bull Bear Power Indicator for the S&P 500 Index is retreating from extreme bullish conditions, confirming this week’s sell-off.
Market Sentiment Analysis
Equity futures point to a bullish start this morning after US President Trump extended the ceasefire with Iran, citing a seriously fractured Iranian government, while Iran criticized the talks as a waste of time amid the US's lack of commitment to previous deals. The Senate hearing to confirm Kevin Warsh as the next Fed chair is ongoing, while earnings from Tesla, AT&T, and Boeing are scheduled for today.
RTX Corporation Fundamental Analysis
RTX Corporation (RTX) is a defense and aerospace conglomerate, one of the largest global aerospace and defense manufacturers by revenue and market capitalization, and a major contractor to the intelligence community.
So, why am I bullish on RTX despite its post-earnings sell-off?
RTX Corporation beat revenue and earnings-per-share expectations of $21.46 billion and $1.52 by reporting revenues of $22.08 billion and $1.78, respectively. It also raised its full-year guidance, and I am bullish amid surging defense replenishment demand, such as the 850 Tomahawk missiles fired in the Iran war. I am equally bullish on its record $268 billion backlog and its commercial aerospace recovery.
Metric | Value | Verdict |
P/E Ratio | 35.12 | Bearish |
P/B Ratio | 4.04 | Bearish |
PEG Ratio | 2.74 | Bearish |
Current Ratio | 1.02 | Bearish |
ROIC-WACC Ratio | Negative | Bearish |
The price-to-earnings (P/E) ratio of 35.12 makes RTX an expensive stock. By comparison, the P/E ratio for the S&P 500 Index is 25.64.
The average analyst price target for RTX is $216.02. It suggests strong upside potential with reduced downside risk.
Top Regulated Brokers
RTX Corporation Technical Analysis
Today’s RTX Signal
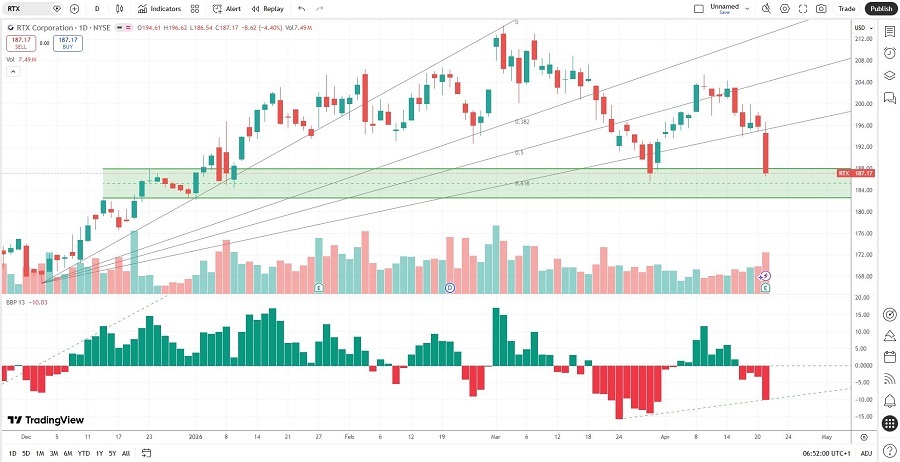
The RTX D1 chart shows price action entering a horizontal support zone.
It also shows price action breaking down below its ascending Fibonacci Retracement Fan.
The Bull Bear Power Indicator is bearish with an ascending trendline.
The average bearish trading volumes are higher than the average bullish trading volumes, suggesting more short-term volatility ahead.
RTX corrected more than the S&P 500 Index, a bearish confirmation, but bullish indicators are rising.
My RTX Long Stock Trade
RTX Entry Level: Between $182.28 and $188.00
RTX Take Profit: Between $214.50 and $218.79
RTX Stop Loss: Between $166.74 and $172.50
Risk/Reward Ratio: 2.07
Ready to trade our analysis of the best stocks analysis? Here is our list of the best stock brokers worth checking out.